- Page 1 and 2:
Hazard anticipation of young novice
- Page 3 and 4:
SWOV-Dissertatiereeks, Leidschendam
- Page 5 and 6:
Promotores: Prof. dr. W.H. Brouwer
- Page 7 and 8:
development of hazard perception te
- Page 10 and 11:
Table of contents 1. General introd
- Page 14 and 15:
1. General introduction 1.1. Hazard
- Page 16 and 17:
27% of all driver fatalities were d
- Page 18 and 19:
eported 73 car crashes during the p
- Page 20 and 21:
with respondents that started their
- Page 22 and 23:
2. Determinants that influence haza
- Page 24 and 25:
planning of a trip, choice of the m
- Page 26 and 27:
that encompasses the entire second
- Page 28 and 29:
peaks at 16.7 years of age in girls
- Page 30 and 31:
Figure 2.2. Model of the different
- Page 32 and 33:
Keating (2007) mentioned the matura
- Page 34 and 35:
Table 2.1. Relative fatality ratios
- Page 36 and 37:
When do these sex differences emerg
- Page 38 and 39:
Functional brain differences in boy
- Page 40 and 41:
oth groups had in common was their
- Page 42 and 43:
3. Extroversion: Extrovert persons
- Page 44 and 45:
is less in these brain areas, but a
- Page 46 and 47:
2.4.2. Peer group influences In ado
- Page 48 and 49:
deduced that car drivers younger th
- Page 50 and 51:
or little interference with the dri
- Page 52 and 53:
2.4.4. Socioeconomic and cultural b
- Page 54 and 55:
Preusser, 2002). The crash rate of
- Page 56 and 57:
impact on road safety. Despite the
- Page 58 and 59:
condition for the older, more exper
- Page 60 and 61:
person (e.g. a passenger or a pedes
- Page 62 and 63:
tasks was 3.10, 95% CI [1.73, 5.47]
- Page 64 and 65:
traffic situation is safe enough to
- Page 66 and 67:
2.6.1. Exposure In Section 1.2, the
- Page 68 and 69:
58 56 Male Drivers Female Drivers S
- Page 70 and 71:
100 Killed car occupants aged 18-24
- Page 72:
less well equipped to detect and re
- Page 75 and 76:
3.2. Hazard anticipation A hazard i
- Page 77 and 78:
Drivers are aware of hazards when t
- Page 79 and 80:
1. Possible other road users on col
- Page 81 and 82:
oriented and the vertical axis is t
- Page 83 and 84:
away from me, given the particular
- Page 85 and 86:
the task demands. The range of acce
- Page 87 and 88:
Figure 3.4. Zero-risk model (Näät
- Page 89 and 90:
with FTD, poor monitoring of the ri
- Page 91 and 92:
elatively high speed in the same di
- Page 93 and 94:
only associated with top-down activ
- Page 95 and 96:
information transformation processe
- Page 97 and 98:
(consciously) controlled action reg
- Page 99 and 100:
on the left lane of a motorway (in
- Page 101 and 102:
3.7.1, 3.7.2 and 3.7.3. This is don
- Page 103 and 104:
driver does not think that she or h
- Page 105 and 106:
for experienced drivers even in cir
- Page 107 and 108:
sound was heard) and some participa
- Page 109 and 110:
stage. In this stage, learners comm
- Page 111 and 112:
A theory that explains how we may l
- Page 113 and 114:
were about to turn left while their
- Page 116 and 117:
4. Hazard anticipation, age and exp
- Page 118 and 119:
hazards, drivers have to imagine a
- Page 120 and 121:
overview of their studies: McKenna
- Page 122 and 123:
with regard to the risk felt in the
- Page 124 and 125:
Participants were requested to pres
- Page 126 and 127:
of the visual acuity in the fovea.
- Page 128 and 129:
working memory. Both bottom-up proc
- Page 130 and 131:
without gaze control (the gray arro
- Page 132 and 133:
urban areas than on rural roads, no
- Page 134 and 135:
the right between the parked cars i
- Page 136 and 137:
that in the video clips no visible
- Page 138 and 139:
• Young learner drivers (age rang
- Page 140 and 141:
• Did you have moments that you t
- Page 142 and 143:
difference between overt latent haz
- Page 144 and 145:
4.2.3. Procedure On arrival, the ex
- Page 146 and 147:
ecognition task, risk assessment an
- Page 148 and 149:
Table 4.1. Percentage of the partic
- Page 150 and 151:
that cognitive aspects of hazard an
- Page 152 and 153:
80 70 Mean percentage mentioned cov
- Page 154 and 155:
Table 4.3. Percentages of latent ha
- Page 156 and 157:
latent hazards was higher than the
- Page 158 and 159:
Discussion about fixated latent haz
- Page 160 and 161:
mentioned latent hazards, young lea
- Page 162 and 163:
Gaze directions and fixation durati
- Page 164 and 165:
4.3.3. Relationship between the two
- Page 166 and 167:
selection task cannot be used to te
- Page 168 and 169:
Underwood, Chapman et al. (2002) an
- Page 170 and 171: more difficulties to detect and rec
- Page 172 and 173: 5. Testing hazard anticipation, an
- Page 174 and 175: • The video task and the photo ta
- Page 176 and 177: animation clips were made, each las
- Page 178 and 179: The photo task Three experts on the
- Page 180 and 181: 5.2.3. Procedure Participants were
- Page 182 and 183: 5.2.6. Overt and covert latent haza
- Page 184 and 185: The effect size was small, η 2 P =
- Page 186 and 187: action selection task of Chapter 4,
- Page 188 and 189: 3. Effect of interruptions The inte
- Page 190 and 191: 5.3.3. Procedure Participants were
- Page 192 and 193: The mean click score was M = 7.7 (S
- Page 194 and 195: ottom-up gaze control (the tractor
- Page 196 and 197: 6. Simulator-based hazard anticipat
- Page 198 and 199: al., 2002; Regan, Triggs, & Godley,
- Page 200 and 201: esources to vehicle control (steeri
- Page 202 and 203: of the University of Massachusetts
- Page 204 and 205: In contrast, Ivancic & Hesketh (200
- Page 206 and 207: students, whereas participants that
- Page 208 and 209: for the training were based on thos
- Page 210 and 211: 6.2.3. Training intervention SimRAP
- Page 212 and 213: A screen capture of the centre scre
- Page 214 and 215: Table 6.2. (continued) critical sit
- Page 216 and 217: at least sixteen of the nineteen si
- Page 218 and 219: latent hazards. This is not very su
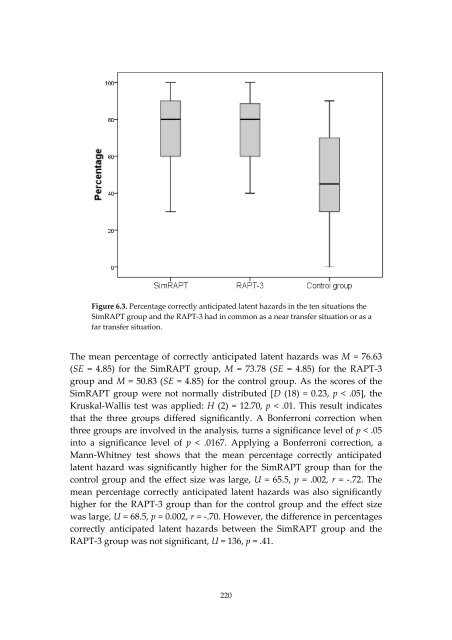
- Page 222 and 223: The combined three near transfer si
- Page 224 and 225: training program was mostly on over
- Page 226 and 227: 7. Discussion and conclusions 7.1.
- Page 228 and 229: ehaviour could be the cause of unsa
- Page 230 and 231: transport. It can also be status, a
- Page 232 and 233: of this is an intervention in the a
- Page 234 and 235: performance in hazard detection and
- Page 236 and 237: than both other groups. It is likel
- Page 238 and 239: etter scanning for latent hazards i
- Page 240 and 241: hazards are a good indicator of som
- Page 242 and 243: order to avoid attribution of an ex
- Page 244 and 245: References Abelson, R.P. (1981). Ps
- Page 246 and 247: underlying reaction time to visual
- Page 248 and 249: Darby, P., Murray, W. & Raeside, R.
- Page 250 and 251: Fuller, R. (2007b). Motivational de
- Page 252 and 253: Irwin, D.E. (2004). Fixation locati
- Page 254 and 255: Louwerens, J.W., Gloerich, A.B.M.,
- Page 256 and 257: Murray, Å. (1998). The home and sc
- Page 258 and 259: Roth, M. (2009). Social support as
- Page 260 and 261: Ulleberg, P. (2001). Personality su
- Page 262 and 263: Summary Driving most of the times,
- Page 264 and 265: Deficit Hyperactivity Disorder (ADH
- Page 266 and 267: framework of Brouwer & Schmidt (200
- Page 268 and 269: and older learner drivers. From the
- Page 270 and 271:
prepare participants for the tasks.
- Page 272:
group than before the training and
- Page 275 and 276:
verkeer. Het probleem van de jonge
- Page 277 and 278:
status en een auto betekent ook vri
- Page 279 and 280:
Belangrijk is dat zowel bij zichtba
- Page 281 and 282:
en ervaren bestuurders (Huestegge e
- Page 283 and 284:
afgerond, hadden ook een significan
- Page 285 and 286:
om hun veiligheidsmarge te vergrote
- Page 288:
About the author Willem Vlakveld wa
- Page 291 and 292:
4. On a rural road when driving str
- Page 293 and 294:
they keep on walking in the same di
- Page 295 and 296:
5. The driver drivers straight on a
- Page 298 and 299:
Appendix 3 Additional latent hazard
- Page 300 and 301:
Appendix 4 Glossary of abbreviation
- Page 302 and 303:
economic progress and world trade.
- Page 304 and 305:
Appendix 5 Glossary on brain issues
- Page 306 and 307:
Gonadotropin releasing hormone Gray
- Page 308 and 309:
MEG Motor cortex MRI Myelination Ne
- Page 310 and 311:
PFC Serotonin Striatum Synaptic pru
- Page 312 and 313:
SWOV-Dissertatiereeks In deze reeks


