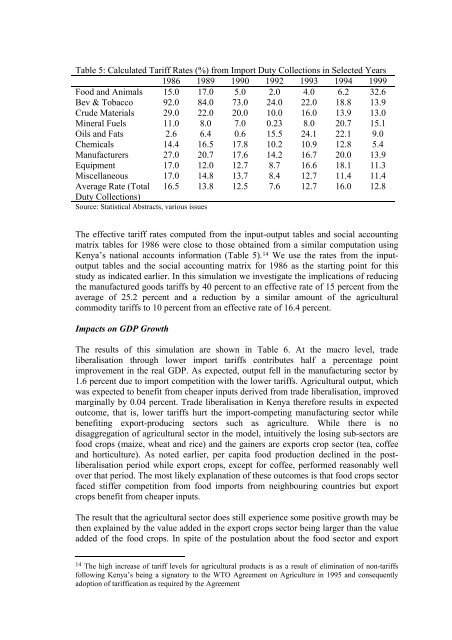
- Page 1 and 2:
Part One - Agricultural Productivit
- Page 3 and 4:
I. Introduction Agricultural Produc
- Page 5 and 6:
came about from expansion of cultiv
- Page 7 and 8:
study, therefore, limited itself to
- Page 9 and 10:
Land allocation and yields of 12 cr
- Page 11 and 12:
Table 6: Key economic variables for
- Page 13 and 14:
local seed in absolute terms and th
- Page 15 and 16:
Table 11: Crosscutting priority con
- Page 17 and 18:
Table 13: General constraints to ma
- Page 19 and 20:
These results clearly demonstrate t
- Page 21 and 22:
Table 18: Crosscutting constraints
- Page 23 and 24:
V. Policy Implications The findings
- Page 25 and 26:
References Appleton, Simon (2001).
- Page 27 and 28:
1.0 BACKGROUND 1.1 Introduction Low
- Page 29 and 30:
egins with a summary of the literat
- Page 31 and 32:
Source: National Wetlands Conservat
- Page 33 and 34:
shillings (§37-38). Every landowne
- Page 35 and 36:
Similarly, Howard (1995) used socia
- Page 37 and 38:
Uganda may well have more than a qu
- Page 39 and 40:
factors that explain household leve
- Page 41 and 42:
of inputs 18 , pests and diseases,
- Page 43 and 44:
(PMA p. 27). It also requires impro
- Page 45 and 46:
agriculturalists, who still do not
- Page 47 and 48:
to have covered 30,000 ha. During t
- Page 49 and 50:
4.0 RESEARCH METHODOLOGY The breadt
- Page 51 and 52:
• What is the current extent of w
- Page 53 and 54:
Figure 2. Changes in Sources of Com
- Page 55 and 56:
Figure 5. Proportion of Households
- Page 57 and 58:
estimates are remarkably consistent
- Page 59 and 60:
FSI - Percentage by District Distri
- Page 61 and 62:
was corrected using the White-Huber
- Page 63 and 64:
utilization for the household. Howe
- Page 65 and 66:
The nature of the structures to con
- Page 67 and 68:
impact of irrigation on horticultur
- Page 69 and 70:
growing population. Wetland protect
- Page 71 and 72:
APPENDICES Appendix 1. The Wetlands
- Page 73 and 74:
Appendix 2. THE 5V’s PRIORITY CLA
- Page 75 and 76:
Appendix 5. Determinants of Product
- Page 77 and 78:
Estimated covariances = 79 Number o
- Page 79 and 80:
International Food Policy Research
- Page 81 and 82:
Scherr, Sara J., 1999b. Poverty-env
- Page 83 and 84:
Land Tenure, Agricultural Productiv
- Page 85 and 86:
1.3 Statement of the problem Land s
- Page 87 and 88:
In order to achieve these objective
- Page 89 and 90:
densely populated Nyeri and Kakameg
- Page 91 and 92:
Figure 3: Conceptual Model Type of
- Page 93 and 94: Figure 4: Location of the Study Dis
- Page 95 and 96: By 2001, land demarcation and regis
- Page 97 and 98: 3.4 Survey Design The survey was un
- Page 99 and 100: 3.5.3 Model of Environmental Degrad
- Page 101 and 102: questionnaire (Figure 8). Prominent
- Page 103 and 104: Figure 10: Availability of hired la
- Page 105 and 106: Figure 13 shows the level of cultiv
- Page 107 and 108: joint significance test on the 4 dr
- Page 109 and 110: Table 8: Regression Results on Maiz
- Page 111 and 112: was classified into three categorie
- Page 113 and 114: Table 9: Tobit Analysis with Enviro
- Page 115 and 116: 5.0 CONCLUSIONS AND POLICY IMPLICAT
- Page 117 and 118: 5.5 Access to Market A number of fa
- Page 119 and 120: FAO (2003b). “Women and Food Secu
- Page 121 and 122: Omiti John and Paul Obunde (2002).
- Page 123 and 124: Annex 1: Pearson Correlation Coeffi
- Page 125 and 126: SEXHH SEXLUSER TSECUR VEGCP1 CHILDE
- Page 127 and 128: Part two - Agricultural Markets
- Page 129 and 130: Market Liberalisation and Agricultu
- Page 131 and 132: farms show annual fluctuations, wit
- Page 133 and 134: Figure 2: Recent trends in domestic
- Page 135 and 136: 5. The Model The interest of this s
- Page 137 and 138: sources for each sector. α IM ji a
- Page 139 and 140: Savings Households’ savings are a
- Page 141 and 142: The value-added price is defined th
- Page 143: Specifically, the Government polici
- Page 147 and 148: disincentive to farmers. Inability
- Page 149 and 150: competitiveness. The second one is
- Page 151 and 152: Table 7: Wage Rates and Labour Inco
- Page 153 and 154: Similar simulation is undertaken in
- Page 155 and 156: References Block, S. and C.P. Timme
- Page 157 and 158: Tyler, G. J. and Akinboade, O. 1992
- Page 159 and 160: (A.10) ai ∑ P ϖ P i=1,...,3; j =
- Page 161 and 162: (A.32) price (A.33) P Q = P ( 1+ td
- Page 163 and 164: Table A.2: Variables of KEGEM Varia
- Page 165 and 166: VA A i Efficiency parameter in valu
- Page 167 and 168: CHAPTER FIVE Post-Liberalization Ma
- Page 169 and 170: As alluded to earlier, initial agri
- Page 171 and 172: directly to dairy farmers as animal
- Page 173 and 174: to engage in this new role, the gov
- Page 175 and 176: 2.0 RESEARCH METHODOLOGY 2.1 Overal
- Page 177 and 178: markets with minor gaps in data ser
- Page 179 and 180: Price-series correlations are conve
- Page 181 and 182: Migori Awendo Postliberalization 1,
- Page 183 and 184: model depends on whether or not the
- Page 185 and 186: Table 6b--Unit root tests for price
- Page 187 and 188: Table 8a--Unit root tests for OLS r
- Page 189 and 190: 3.3 The Role of Infrastructure and
- Page 191 and 192: Table 13--Reported distances from t
- Page 193 and 194: Table 15--Reported maize storage pr
- Page 195 and 196:
Table 17--Traders’ perception of
- Page 197 and 198:
3.3.6.2 Awareness of the Liberaliza
- Page 199 and 200:
Retailer (open-air market) 21 13 7
- Page 201 and 202:
3.4 Maize Marketing Costs Traders w
- Page 203 and 204:
3.4.4 License and Market Fees Accor
- Page 205 and 206:
5.Develop farmers’ and traders’
- Page 207 and 208:
Coulter, J., and J. A. F. Compton.
- Page 209 and 210:
Meilink, A. H. 1987. Food consumpti
- Page 211 and 212:
Figure 1 Maize surplus and deficit
- Page 213 and 214:
Figure 3 Trends in Maize Prices 199
- Page 215 and 216:
Price per 90kg bag (Kshs) Mbeere Di
- Page 217 and 218:
Figure 4 Modes of transporting maiz
- Page 219 and 220:
Figure 6: Limitations to storage ca
- Page 221 and 222:
Figure 8: Problems experienced in a
- Page 223 and 224:
CHAPTER SIX Grain Marketing in Addi
- Page 225 and 226:
A third, related explanation argues
- Page 227 and 228:
educed marketing costs related to p
- Page 229 and 230:
1.4. Research questions This study
- Page 231 and 232:
1.6. Organization of the report Thi
- Page 233 and 234:
the cases, respectively (Table 2.4)
- Page 235 and 236:
Brokers believe that most regional
- Page 237 and 238:
There is also a close relationship
- Page 239 and 240:
Table 2.14: Buyers’ methods for i
- Page 241 and 242:
Source: Survey, 2002. Table 2.18: D
- Page 243 and 244:
Table 2.22: Method used to grade di
- Page 245 and 246:
Table 2.25: Access to credit broker
- Page 247 and 248:
It has been reported that grain pur
- Page 249 and 250:
3. GRAIN RETAILERS Retailers serve
- Page 251 and 252:
Like brokers, retailers use cash or
- Page 253 and 254:
Table 3.11: Buyers’ information a
- Page 255 and 256:
Table 3.14: Retailers’ views of g
- Page 257 and 258:
Getting reliable price information
- Page 259 and 260:
Table 4.4: How do you set a sales p
- Page 261 and 262:
Table 4.7: Means of settling disput
- Page 263 and 264:
a.m. The survey included wholesale
- Page 265 and 266:
Table 5.3: Instability index of dai
- Page 267 and 268:
Table 5.7: Seasonality index of who
- Page 269 and 270:
Figure 5.3: Ratio of wholesale to r
- Page 271 and 272:
Table 5.8: Results of stationary te
- Page 273 and 274:
Table 5.10: Summary of Granger caus
- Page 275 and 276:
holiday sales. The results of the r
- Page 277 and 278:
Table 6.1: Storage capacity of the
- Page 279 and 280:
Intermarket grain flow is coordinat
- Page 281 and 282:
• a legal, regulatory, and enforc
- Page 283 and 284:
REFERENCES Al-Hassen, R., A. Dorwar
- Page 285 and 286:
Seppala, P. 1998. Decisive liberali
- Page 287 and 288:
achieve some welfare objective. The
- Page 289 and 290:
Annex Table 2.10: Have you faced di
- Page 291 and 292:
Annex Table 2.21: Do you consider p
- Page 293 and 294:
Annex Table 3.3: Cost structure of
- Page 295 and 296:
Annex Table 4.2: Complementary acti
- Page 297 and 298:
CHAPTER SEVEN Post-Harvest Grain Ma
- Page 299 and 300:
only (see Abebe 2000: 80-83). That
- Page 301 and 302:
of processing as an important post-
- Page 303 and 304:
occur at all stages of post-harvest
- Page 305 and 306:
Endowment & access to Resources (e.
- Page 307 and 308:
Figure 2: The Study Areas (shaded a
- Page 309 and 310:
(6) β i = β 0 λ i , 0
- Page 311 and 312:
Intercrop differences Liquidity con
- Page 313 and 314:
eplace old animals (19 percent of h
- Page 315 and 316:
Table 5. Number and capacity of gra
- Page 317 and 318:
Table 7b.Estimated grain loss durin
- Page 319 and 320:
7.1.3. Grain Marketing Practices an
- Page 321 and 322:
1.8 Producers' price 1.6 1.4 1.2 1
- Page 323 and 324:
next season, grain prices tend to b
- Page 325 and 326:
Table 13: Regression results (Tobit
- Page 327 and 328:
of grain production was reportedly
- Page 329 and 330:
instruments to mitigate price risks
- Page 331 and 332:
Coulter, J. and G. Onumah, (2002).
- Page 333 and 334:
Appendix: Supplementary Tables Appe
- Page 335 and 336:
CHAPTER EIGHT Collective Action in
- Page 337 and 338:
The objectives of DRS were to popul
- Page 339 and 340:
increasing participation. Thus, the
- Page 341 and 342:
Table 2. Perceived change in benefi
- Page 343 and 344:
unsatisfactory (Table 8). Flaws in
- Page 345 and 346:
Table 14. Measures of wealth status
- Page 347 and 348:
Results from Regression Analysis Ta
- Page 349 and 350:
However, to maintain these benefits
- Page 351 and 352:
Table 18. Determinants of participa
- Page 353 and 354:
_______ 1981. Common property and c
- Page 355 and 356:
Management Regulations and Enforcem
- Page 357 and 358:
In theory, under PFM, the governmen
- Page 359 and 360:
3.2 Desk study The desk study invol
- Page 361 and 362:
Table 1: Number and gender of indiv
- Page 363 and 364:
Poverty Increase in number of fishe
- Page 365 and 366:
Table 5: Responses given by various
- Page 367 and 368:
wages after the catch is sold (see
- Page 369 and 370:
70 60 No of respondents 50 40 30 20
- Page 371 and 372:
4.2.3 Lack of attention to social i
- Page 373 and 374:
5.3 Regulate the construction of re
- Page 375 and 376:
REFERENCES Allison, E. H., and P. M
- Page 377 and 378:
APPENDIXES Appendix A: Districts of
- Page 379 and 380:
Questions and responses Government
- Page 381 and 382:
Questions and responses Lack of coo
- Page 383 and 384:
CHAPTER TEN Animal Health Service D
- Page 385 and 386:
• Individuals are selected for tr
- Page 388 and 389:
Makueni district was selected becau
- Page 390 and 391:
1.5 Justification of the study The
- Page 392 and 393:
more sustainable (Leonard 1993; Uma
- Page 394 and 395:
of defined roles for CBAHWs within
- Page 396 and 397:
Interviews with veterinary officers
- Page 398 and 399:
The estimated model was of the form
- Page 400 and 401:
Gender remains a sensitive issue. P
- Page 402 and 403:
The most common ailments and diseas
- Page 404 and 405:
4.3 Factors influencing the level o
- Page 406 and 407:
Table 9 -- Factors influencing the
- Page 408 and 409:
Table 10 - Factors determining the
- Page 410 and 411:
Table 12 -- Current mean numbers of
- Page 412 and 413:
Figure 4: Percentage of household h
- Page 414 and 415:
CBAHWs were the most utilized chann
- Page 416 and 417:
Users of veterinarians’ services
- Page 418 and 419:
Table 18 -- Levels of incomes and l
- Page 420 and 421:
higher average calving per cow, whi
- Page 422 and 423:
Table 21 -- CBAHWs’ ranking of sp
- Page 424 and 425:
epresentative of livestock keepers
- Page 426 and 427:
Despite the restriction imposed by
- Page 428 and 429:
veterinarians. Such associations co
- Page 430 and 431:
References Akabwai, D., V. Shean, a
- Page 432 and 433:
Johnson, P. J., and C. Chahuares. 1
- Page 434 and 435:
Appendix 1: The Logistic Procedure
- Page 436 and 437:
Social Capital and Sustainable Agri
- Page 438 and 439:
1.1 Soil conservation programs and
- Page 440 and 441:
1.3 Research Objectives and Hypothe
- Page 442 and 443:
Institutional and Policy factors -
- Page 444 and 445:
land pressure is high (Holden 1991)
- Page 446 and 447:
include density of membership in gr
- Page 448 and 449:
then summed up according to increas
- Page 450 and 451:
Social capital, resource use, and a
- Page 452 and 453:
Table 4.4 Farmers’ perception of
- Page 454 and 455:
Table 4.5: Empowerment and politica
- Page 456 and 457:
Table 4.8: Indicators of collective
- Page 458 and 459:
Table 4.10: Comparison of means of
- Page 460 and 461:
5. The influence of social capital
- Page 462 and 463:
especially when considered on an ad
- Page 464 and 465:
households may pay less attention t
- Page 466 and 467:
Table 5.3 Determinants of terracing
- Page 468 and 469:
and Gichuki 1994). In the 1940s, th
- Page 470 and 471:
Table 5.4. Determinants of soil con
- Page 472 and 473:
5.3. Social capital, resource use,
- Page 474 and 475:
6. Implications for policy and prog
- Page 476 and 477:
essential for the formation of exte
- Page 478 and 479:
BIBLIOGRPAHY Admassie, Y., L. I. Mw
- Page 480 and 481:
Gambetta, D. 1988. Can we trust tru
- Page 482 and 483:
Social capital and watershed develo
- Page 484 and 485:
Obare, G. A., S. W. Omamo, and J. C
- Page 486 and 487:
Washington D.C.: The World Bank Tem
- Page 488 and 489:
Appendix: A list of Contributors Ab
- Page 490 and 491:
Appendix: Projects Supported Under
- Page 492:
IFPRI Eastern Africa Food Policy Ne


