- Page 1 and 2:
Hanna Lakkala & Jarmo Vehmas (edito
- Page 3 and 4:
CONTENTSINTRODUCTION ..............
- Page 5 and 6:
Implementation of Total responsibil
- Page 7 and 8:
In addition, an expert panel chaire
- Page 9 and 10:
GROUPING AND RANKING THE EU-27 COUN
- Page 11 and 12:
objects, i.e. countries. The city b
- Page 13 and 14:
Motorization rate (number of cars/
- Page 15 and 16:
Cluster 7: Italy, SpainAs can be un
- Page 17 and 18: The northwestern European cluster i
- Page 20 and 21: ReferencesEurostat (2011) Eurostat
- Page 22 and 23: The authors applied both the SUMMA
- Page 24 and 25: 3.1. SUMMA examplesEmissions are a
- Page 26 and 27: sector not in the paid work sector
- Page 28 and 29: sustainability. While non-use and e
- Page 30 and 31: Figure 5.Fund-Flow analysis of Scot
- Page 32 and 33: examination concern e.g. dispersal
- Page 34 and 35: These interlinked themes strongly a
- Page 36 and 37: Social sustainabilitySocial sustain
- Page 38 and 39: Economic sustainabilityThe existenc
- Page 40 and 41: Public transport is efficient (supp
- Page 42 and 43: SECRETARIAT OF THE CONVENTION ON BI
- Page 44 and 45: 1. Introduction and BackgroundThe d
- Page 46 and 47: 3. Case StudiesTwo alternative scen
- Page 48 and 49: (methodological, spatial and time-s
- Page 50 and 51: Comparing with energy uses in Campa
- Page 52 and 53: ESI 0.02 0.02 0.14 0.14% Renewable
- Page 54 and 55: Kamm, B. - Kamm, M. (2004) Principl
- Page 56 and 57: It is possible to identify five pre
- Page 58 and 59: Case study applicationThe Cairngorm
- Page 60 and 61: The language and terminology used b
- Page 62 and 63: utility of MUSIASEM were less varie
- Page 64 and 65: Our findings illustrate that relati
- Page 66 and 67: McNie, E. C. 2007, "Reconciling the
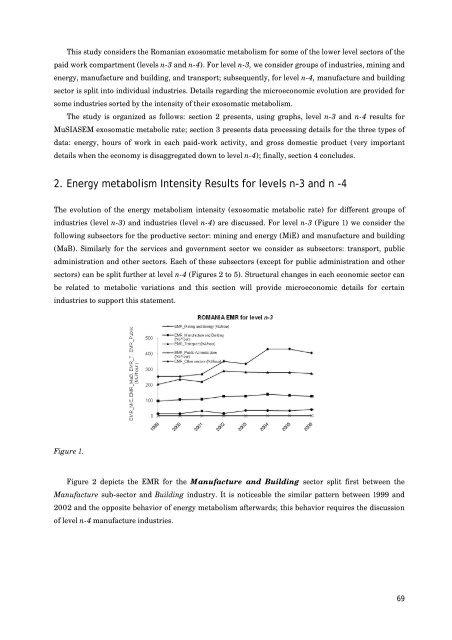
- Page 70 and 71: Figure 2.The Manufacture sector has
- Page 72 and 73: Figure 5.Between 2002 and 2006, Ele
- Page 74 and 75: The database of net taxes on produc
- Page 76 and 77: Serbanescu, I., 2007. Romania Under
- Page 78 and 79: flows such as the residuals of prod
- Page 80 and 81: Consumption (TMC) is a deriavite of
- Page 82 and 83: 6. Imported and Exported Material F
- Page 84 and 85: points of view means that the use o
- Page 86 and 87: TRENDS AND DRIVING FACTORS IN FINNI
- Page 88 and 89: Figure 1.The interlinking of the fr
- Page 90 and 91: Figure 3. The removal of total andc
- Page 92 and 93: 200150100500-50CO2FI/FECFIFECFI/VAF
- Page 94 and 95: ReferencesBraczyk, P.H.J., Cooke, P
- Page 96 and 97: “JUST BEGIN”A CASE STUDY IN CRE
- Page 98 and 99: 2. Materials and MethodsThe role of
- Page 100 and 101: everyone some share in the land’s
- Page 102 and 103: allowing for winter grazing and car
- Page 104 and 105: Useful PrinciplesAn especially impo
- Page 106 and 107: This approach necessarily has major
- Page 108 and 109: POWERING THE FUTURE OF THE LEAST DE
- Page 110 and 111: made interviews in a village that h
- Page 112 and 113: was put on projects predominantly f
- Page 114 and 115: (discussed in more detail in follow
- Page 116 and 117: 4. Solar Home System Program in Lao
- Page 118 and 119:
micro hydro has not received that m
- Page 120 and 121:
And the role of smaller scale solut
- Page 122 and 123:
has become in discourse level the m
- Page 124 and 125:
ReferencesBerliant, Leslie (2009) W
- Page 126 and 127:
DEVELOPING TIBET INTO A SPECIAL SUS
- Page 128 and 129:
are just a curiosity for festivals
- Page 130 and 131:
Environmental sustainabilityEnviron
- Page 132 and 133:
and towns under the reservoir. Howe
- Page 134 and 135:
ailways, airports and townships for
- Page 136 and 137:
(3) social needs: good relations an
- Page 138 and 139:
COPENHAGEN FAILURE AND NORTH-SOUTHD
- Page 140 and 141:
”whoever defines the terms of the
- Page 142 and 143:
Blair makes a division between deve
- Page 144 and 145:
Issue 3: Action suggestionsOne of t
- Page 146 and 147:
change as a serious problem and und
- Page 148 and 149:
aspects. Through the scrutiny of le
- Page 150 and 151:
50 000 ha are currently irrigated.
- Page 152 and 153:
Table 2.The main pieces of legislat
- Page 154 and 155:
Table 3.The main policy documents o
- Page 156 and 157:
However, the Zambian laws on sanita
- Page 158 and 159:
State House (2009). Updated on 16th
- Page 160 and 161:
Forum 2009). As agriculture is the
- Page 162 and 163:
2005; Levy and Newell 2002). These
- Page 164 and 165:
The virtual water ‘flows’ embed
- Page 166 and 167:
value given to the other members of
- Page 168 and 169:
countries of operation, promoting m
- Page 170 and 171:
Hoekstra, A.Y., Chapagain, A.K., (2
- Page 172 and 173:
1723. SUSTAINABLE CONSUMPTION
- Page 174 and 175:
guarantee the consumer’s opportun
- Page 176 and 177:
3. Growth of GDP doesn’t guarante
- Page 178 and 179:
Veblen’s observation on the inter
- Page 180 and 181:
overriding of the ‘interference o
- Page 182 and 183:
consumption has no centre point (or
- Page 184 and 185:
Habermas, J., 1968. Erkenntnis und
- Page 186 and 187:
2010). However, people who prioriti
- Page 188 and 189:
Table 2.Operationalizing of attitud
- Page 190 and 191:
material intensity, which is driven
- Page 192 and 193:
225 cases of serious illness per te
- Page 194 and 195:
instance, to tax labor in the frame
- Page 196 and 197:
Anderson, A., Harris, T., Tylavsky,
- Page 198 and 199:
Heiskala, R. (2000). Toiminta, tapa
- Page 200 and 201:
Rauh, V., Arunajadai, S., Horton, M
- Page 202 and 203:
MAXIMUM AND MINIMUM CONSUMPTION- TW
- Page 204 and 205:
possibilities to participate in the
- Page 206 and 207:
udgets were mostly selected by expe
- Page 208 and 209:
Figure 1.Material footprint of the
- Page 210 and 211:
eference budgets. A reduction in li
- Page 212 and 213:
Schmidt-Bleek,F. (2009) The Earth:
- Page 214 and 215:
A CONCEPTUAL FRAMEWORK FOR LIFE CYC
- Page 216 and 217:
Geels notes that for transitions to
- Page 218 and 219:
Hafkamp (2002), working from the ec
- Page 220 and 221:
4.1. LCT based analysis as a test f
- Page 222 and 223:
effect, this image establishes a vi
- Page 224 and 225:
management strategies, it has been
- Page 226 and 227:
5.2.3. Subsidiarity: Level of imple
- Page 228 and 229:
Council Directive. 2008. 2008/98/EC
- Page 230 and 231:
LAND USE FOR BIOENERGY PRODUCTION -
- Page 232 and 233:
Economic: part of the technical pot
- Page 234 and 235:
local food production system. Conse
- Page 236 and 237:
As can be seen from the graph above
- Page 238 and 239:
ReferencesBerndes G, Hoogwijk M, va
- Page 240 and 241:
DRIVERS AND BARRIERS TO SUSTAINABLE
- Page 242 and 243:
Figure 1.Dynamic and Folding Field
- Page 244 and 245:
esponses to an array of possible em
- Page 246 and 247:
Leadership and institutionsThe SEQC
- Page 248 and 249:
not preferable. Scenario 4: Transfo
- Page 250 and 251:
Figure 2.Practical responses across
- Page 252 and 253:
Wilber, Ken. 2001. A Theory of Ever
- Page 254 and 255:
2. Background and LiteratureSustain
- Page 256 and 257:
about environmental challenges. Sco
- Page 258 and 259:
interconnectedness of globalization
- Page 260 and 261:
ConclusionThe analysis of the data
- Page 262 and 263:
ReferencesAgenda 21, Chapter 36. Th
- Page 264 and 265:
2. Theory and LiteratureTo achieve
- Page 266 and 267:
There probably are professional dif
- Page 268 and 269:
design fields, 2 from economics and
- Page 270 and 271:
out. While there are some necessary
- Page 272 and 273:
J. (Eds.) Proceedings of LeNS Confe
- Page 274 and 275:
INNOVATIVE FISCAL POLICY IN THE CON
- Page 276 and 277:
3. A concept of innovative fiscal p
- Page 278 and 279:
transfers, and social contributions
- Page 280 and 281:
Although Finland can be ranked into
- Page 282 and 283:
which induced lower tax revenues -
- Page 284 and 285:
panacea; furthermore, unlegislated
- Page 286 and 287:
ReferencesAfonso, A. - Hauptmeier,
- Page 288 and 289:
In this paper are presented some fi
- Page 290 and 291:
The baseline scenario for 2011-2012
- Page 292 and 293:
Indirect effects: the increased wei
- Page 294 and 295:
AcknowledgementsThis paper was supp
- Page 296 and 297:
e added to the domestic hidden econ
- Page 298 and 299:
case when all household are involve
- Page 300 and 301:
(from 70.8% in 1997 to 63.1% in 200
- Page 302 and 303:
Appendix 1Shares of informal income
- Page 304 and 305:
H2 Estimations under the hypotheses
- Page 306 and 307:
1999). In this analysis the Finnish
- Page 308 and 309:
warming, growing environmental burd
- Page 310 and 311:
aggregate indicator. It is by no me
- Page 312 and 313:
Diefenbacher, H. 1994. The index of
- Page 314 and 315:
3147. CORPORATE RESPONSIBILITY
- Page 316 and 317:
themselves - both in day-to-day bus
- Page 318 and 319:
3. How do we arrive at big picture?
- Page 320 and 321:
Figure 3.Pillars of sustainability
- Page 322 and 323:
That communication, networking, and
- Page 324 and 325:
companies already consider the sust
- Page 326 and 327:
1. IntroductionCompanies leading in
- Page 328 and 329:
Figure 1.Sources of InnovationExami
- Page 330 and 331:
penetration of disruptive innovatio
- Page 332 and 333:
introduced by Canon which eventuall
- Page 334 and 335:
Scenario 4 - Disruptive Era: This i
- Page 336 and 337:
Margolis, J.D. and Walsh, J. P. 200
- Page 338 and 339:
1. IntroductionTotal Quality manage
- Page 340 and 341:
Waddock and Graves, 1997). Neverthe
- Page 342 and 343:
organizations to discover and creat
- Page 344 and 345:
undertaken to pursue a sustainable
- Page 346 and 347:
and ways to enhance and effectively
- Page 348 and 349:
Waddock, SA & Graves, SB 1997. ‘T
- Page 350 and 351:
the company and its stakeholders. O
- Page 352 and 353:
persons. About 30% of the shares ar
- Page 354 and 355:
working groups and board of directo
- Page 356 and 357:
sustainability webpages and press r
- Page 358 and 359:
Näsi, Juha (1995) What is stakehol
- Page 360 and 361:
the indirect and inter-stakeholder
- Page 362 and 363:
In June 2005, the presidents of Uru
- Page 364 and 365:
examine the stakeholder relationshi
- Page 366 and 367:
Union expressed its’ support to t
- Page 368 and 369:
The analysis of this case illustrat
- Page 370 and 371:
Meyer, K. E., Mudambi, R. & Narula,
- Page 372 and 373:
(Vandenbergh 2007; McBarnet and Kur
- Page 374 and 375:
Finally, enforceability is another
- Page 376 and 377:
3.2. OverviewThe legal scholarship
- Page 378 and 379:
law, transnational private regulati
- Page 380 and 381:
The SA8000, a certification based s
- Page 382 and 383:
As the analyzed literature shows, t
- Page 384 and 385:
Shaffer, G. and Pollack, M.A.., 201
- Page 386 and 387:
documents and to correct the disclo
- Page 388 and 389:
2.2. The EU CSR disclosure regimeSi
- Page 390 and 391:
The decision laid down the path for
- Page 392 and 393:
2011). More fundamental criticisms
- Page 394 and 395:
espect of the materiality of CSR re
- Page 396 and 397:
unexpected side effects as well. As
- Page 398 and 399:
HEITZMAN, S., WASLEY, C. E. & ZIMME
- Page 400 and 401:
4008. FUTURES METHODS
- Page 402 and 403:
1. IntroductionThe Finnish society
- Page 404 and 405:
Figure 2.An analysis on effectivene
- Page 406 and 407:
In the following the scenarios are
- Page 408 and 409:
Development corresponds closest to
- Page 410 and 411:
THE SIGNIFICANCE OF WILD CARDS AND
- Page 412 and 413:
infrastructure sector. Thus, the ne
- Page 414 and 415:
consulted the right experts or if w
- Page 416 and 417:
Tampere area and Lapin Kansa is pub
- Page 418 and 419:
Here are just a few examples of the
- Page 420 and 421:
transparent decision-making. If pol
- Page 422 and 423:
Local and Regional Authorities.http
- Page 424 and 425:
DELPHI ON TRANSPORT AND CO 2 EMISSI
- Page 426 and 427:
which had offered little informatio
- Page 428 and 429:
and sidewalks. The use and ownershi
- Page 430 and 431:
very slow decrease after the year 2
- Page 432 and 433:
emissions of the car, and the annua
- Page 434 and 435:
Finnish Government (2008) Long-term
- Page 436 and 437:
ANALYSING THE SUSTAINABILITY OF ROA
- Page 438 and 439:
developed countries but not globall
- Page 440 and 441:
only are useful in stable condition
- Page 442 and 443:
analysis and literature survey form
- Page 444 and 445:
However, the survey did not give in
- Page 446 and 447:
DETR (1999) Sustainable distributio
- Page 448 and 449:
complex and systematic understandin
- Page 450 and 451:
The structure and aims of the paper
- Page 452 and 453:
Table 1.Steps of the ANT-derived me
- Page 454 and 455:
After the first iteration the impor
- Page 456 and 457:
in the real world? Since the lack o
- Page 458 and 459:
SMALL STEP TOWARDS SUSTAINABLE TRAN
- Page 460 and 461:
Quantitative content analysis was p
- Page 462 and 463:
general, attitudes towards car tax
- Page 464 and 465:
Future orientation of the discussio
- Page 466 and 467:
public, there were little possibili
- Page 468 and 469:
46810. SUSTAINABLE ENERGY
- Page 470 and 471:
meaningful components and compares
- Page 472 and 473:
fuel combustion. Positive values fo
- Page 474 and 475:
We analyse the changes in the count
- Page 476 and 477:
200180160140120100806040200Activity
- Page 478 and 479:
has had considerable impact on CO 2
- Page 480 and 481:
The structural decomposition analys
- Page 482 and 483:
Intensity effect on Final Energy Co
- Page 484 and 485:
%China, factors affecting CO 2 emis
- Page 486 and 487:
4. ConclusionsThe decomposition ana
- Page 488 and 489:
MICROALGAE AS A BIOFUEL FEEDSTOCK:
- Page 490 and 491:
are dominating the international ag
- Page 492 and 493:
3.1.3. BiodiversityBiodiversity is
- Page 494 and 495:
Moreover, people attach more and mo
- Page 496 and 497:
important role in tackling with or
- Page 498 and 499:
Spolaore P., Joannis C. C., Duran E
- Page 500 and 501:
DESIGNING SUSTAINABLE INNOVATIONSK.
- Page 502 and 503:
disciplines and socialised in diffe
- Page 504 and 505:
5. Corporate contextKSB is a medium
- Page 506 and 507:
Most important, BOS does not touch
- Page 508 and 509:
ongoing or expected changes in the
- Page 510 and 511:
1Idea andevaluation2Clarif. ofobjec
- Page 512 and 513:
Arthur. 2009. The Nature of Technol
- Page 514 and 515:
SUSTAINABILITY AWARENESS IN DESIGN
- Page 516 and 517:
Figure 1.Left: The various roles of
- Page 518 and 519:
longer product centred. It is widel
- Page 520 and 521:
the competence to help develop dema
- Page 522 and 523:
Figure 4.Survey framework: Dimensio
- Page 524 and 525:
gap. In our survey, the lack of con
- Page 526 and 527:
SUSTAINABILITY AND INDUSTRIAL DESIG
- Page 528 and 529:
“memories of the future” that e
- Page 530 and 531:
that it is quite common for compani
- Page 532 and 533:
3. How will sustainability change:
- Page 534 and 535:
e sensitive to sustainability as th
- Page 536 and 537:
Industrial Designers Society of Ame