- Page 1 and 2:
International Water Association AGR
- Page 3 and 4:
2006 Conference Organising Committe
- Page 5 and 6:
Theme 2: Cost-effectiveness of Best
- Page 7 and 8:
Poster Presentations The Farm Soils
- Page 9 and 10:
viii
- Page 11 and 12:
managers need support in understand
- Page 13 and 14:
During the past 20 years, it became
- Page 15 and 16:
infiltration); and (4) capture, sto
- Page 17 and 18:
DOMINATING PARAMETERS OF IMPAIRMENT
- Page 19 and 20:
Using the results of the unsupervis
- Page 21 and 22:
Kohonen T (2001). Self-Organizing M
- Page 23 and 24:
WATER FRAMEWORK DIRECTIVE IMPLEMENT
- Page 25 and 26:
Table 1: Modelled total annual loss
- Page 27 and 28:
• It should be possible to apply
- Page 29 and 30:
Scottish Executive against 18 measu
- Page 31 and 32:
REFERENCES Anthony S, Betson M, Lor
- Page 33 and 34:
ased on the ‘drainage basin’ in
- Page 35 and 36:
management practices’ (BMPs) toge
- Page 37 and 38:
It is envisaged that these data wil
- Page 39 and 40:
testing (including climate change)
- Page 41 and 42:
Council of the European Communities
- Page 43 and 44:
DECREASING THE NITROGEN SOIL SURFAC
- Page 45 and 46:
Table 1: Overview of the measures c
- Page 47 and 48:
Table 2: Costs (C), effects (E) and
- Page 49 and 50:
Figure 2: Combination of ‘best av
- Page 51 and 52: MATERIALS AND METHODS At the 5-km 2
- Page 53 and 54: REFERENCES Jordan P, Menary W, Daly
- Page 55 and 56: Although the TMDL programme origina
- Page 57 and 58: grassland and heather moorland, sup
- Page 59 and 60: Given that the release of P from th
- Page 61 and 62: to the underlying causes, and thus
- Page 63 and 64: All water body use attainment infor
- Page 65 and 66: indicate the possible presence of p
- Page 67 and 68: DEVELOPMENT AND IMPLEMENTATION OF M
- Page 69 and 70: BMP is being implemented and the ap
- Page 71 and 72: THE USE OF PONDS TO REDUCE POLLUTIO
- Page 73 and 74: established pond/wetland for nutrie
- Page 75 and 76: Table 1: Hydraulic load, mean water
- Page 77 and 78: Comparable SS removals have been re
- Page 79 and 80: Reddy GB, Hunt PG, Phillips R, Ston
- Page 81 and 82: In general, the combinations of mea
- Page 83 and 84: final word on the POMs selection an
- Page 85 and 86: CONCLUSIONS The ERBD project team i
- Page 87 and 88: Table 1: A summary of the measures
- Page 89 and 90: Table 3: A summary of the represent
- Page 91 and 92: cost (£'000/farm) or reduction in
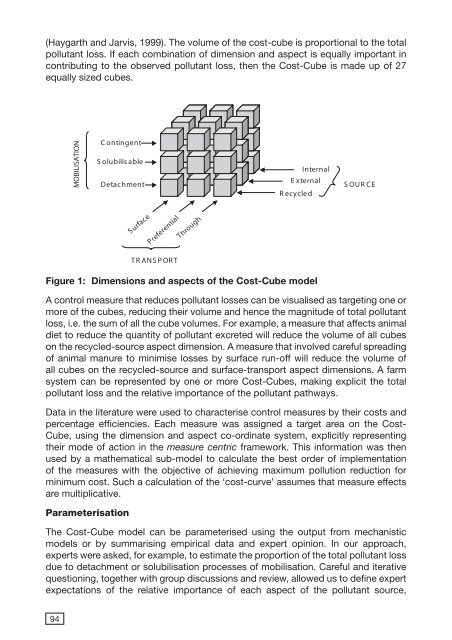
- Page 93 and 94: ECONOMIC IMPLICATIONS OF MINIMISING
- Page 95 and 96: spread cattle slurry in the autumn
- Page 97 and 98: £25,000. The investment in trailin
- Page 99 and 100: Studies on a drained clay soil at B
- Page 101: REFERENCES Anon (2000). Fertiliser
- Page 105 and 106: Application Representative farm sys
- Page 107 and 108: Table 2: Modelled cost-curve for th
- Page 109 and 110: ASSESSING THE SIGNIFICANCE OF DIFFU
- Page 111 and 112: In the absence of data on the sourc
- Page 113 and 114: Magnitude of Impacts The magnitude
- Page 115 and 116: D. Use relative area of farm and wh
- Page 117 and 118: ADAS has developed a matrix for Def
- Page 119 and 120: Dickson JW, Edwards T, Jeffrey WA,
- Page 121 and 122: 60% phosphorus and 50% nitrogen of
- Page 123 and 124: RESULTS AND DISCUSSION Landscape St
- Page 125 and 126: was contributed to the low vegetati
- Page 127 and 128: iological uptake in a grassed area.
- Page 129 and 130: Tim US, Jolly R and Liao HH (1995).
- Page 131 and 132: to control SS and P loads from agri
- Page 133 and 134: Total P inputs in fertilisers and m
- Page 135 and 136: Within the Teme catchment, largest
- Page 137 and 138: A RISK ASSESSMENT AND MITIGATION ST
- Page 139 and 140: Environmental Monitoring The primar
- Page 141 and 142: BMP measure 1 (exclusion of stock f
- Page 143 and 144: (a) With reference to the increase
- Page 145 and 146: ACKNOWLEDGEMENTS SAC acknowledges f
- Page 147 and 148: The Environment Sensitive Farming (
- Page 149 and 150: improved further as a result of att
- Page 151 and 152: to do more to reduce pesticide impa
- Page 153 and 154:
MANAGING DIFFUSE POLLUTION FROM A F
- Page 155 and 156:
turbulent air mixing. The effect th
- Page 157 and 158:
Although nitrate leaching can be re
- Page 159 and 160:
infiltration of water sheeting off
- Page 161 and 162:
Nisbet TR, Orr H and Broadmeadow S
- Page 163 and 164:
anthropogenic activities are pollut
- Page 165 and 166:
monitoring is determined up front b
- Page 167 and 168:
(USEPA). Nevertheless, by applying
- Page 169 and 170:
• Sampling equipment •Laborator
- Page 171 and 172:
Reinert RE, Knuth BA, Kamrin MA and
- Page 173 and 174:
Tier 3 - Tier 3 of LMCs is planned
- Page 175 and 176:
policy literature, although this is
- Page 177 and 178:
Figure 1: Individual-collective spe
- Page 179 and 180:
• tailoring activities to local c
- Page 181 and 182:
ACKNOWLEDGEMENTS The support of the
- Page 183 and 184:
THE EFFECT OF DIFFUSE POLLUTION FRO
- Page 185 and 186:
equires the Minister to designate a
- Page 187 and 188:
protection and restoration, sustain
- Page 189 and 190:
expensive. One-to-one contact becom
- Page 191 and 192:
farmers. In England, recent policy
- Page 193 and 194:
practices but, hopefully, the chang
- Page 195 and 196:
A CASE STUDY: ADOPTION OF BEST MANA
- Page 197 and 198:
The approaches taken by Brittany to
- Page 199 and 200:
MANURE TREATMENT By January 2005, t
- Page 201 and 202:
REGULATORY OPTIONS FOR THE MANAGEME
- Page 203 and 204:
There are also measures that contro
- Page 205 and 206:
widely recognised as needing much a
- Page 207 and 208:
ploughed, of rivers and streams tha
- Page 209 and 210:
is the only mechanism identified fo
- Page 211 and 212:
PHOSPHORUS STORAGE IN FINE CHANNEL
- Page 213 and 214:
structure and minimum level of main
- Page 215 and 216:
REFERENCES May L, Place C, O’Hea
- Page 217 and 218:
LOUND CATCHMENT PROJECT: WORKING WI
- Page 219 and 220:
MINIMISING THE PRESSURES AND IMPACT
- Page 221 and 222:
Predicting Bathing Water Quality Vi
- Page 223 and 224:
Risk of illness percentages were ca
- Page 225 and 226:
Table 4: Expected lifetime benefits
- Page 227 and 228:
DETERMINATION OF THE VETERINARY ANT
- Page 229 and 230:
Thin Layer Chromatography The sampl
- Page 231 and 232:
Table 2: Regression functions and c
- Page 233 and 234:
OPPORTUNITIES AND CONSTRAINTS FOR U
- Page 235 and 236:
to land managers and agency staff t
- Page 237 and 238:
stakeholders, together with their i
- Page 239 and 240:
REFERENCES EC (2000). Directive 200
- Page 241 and 242:
A third scenario was applied to Clu
- Page 243 and 244:
Based on a detailed distribution of
- Page 245 and 246:
could be misleading. The results of
- Page 247 and 248:
TACKLING DIFFUSE NITRATE POLLUTION:
- Page 249 and 250:
AMMONIA VOLATILISATION FROM CATTLE
- Page 251 and 252:
and 27% of the soil surface at 80 m
- Page 253 and 254:
FIELD TESTING OF MITIGATION OPTIONS
- Page 255 and 256:
techniques can significantly reduce
- Page 257 and 258:
NITRATE CONTAMINATION OF GROUNDWATE
- Page 259 and 260:
MATERIALS AND METHODS At two UK sit
- Page 261 and 262:
ACKNOWLEDGEMENTS Funding of this wo
- Page 263 and 264:
y standard methods and fresh, end o
- Page 265 and 266:
comparable to those in water draini
- Page 267 and 268:
Results may be influential in deter
- Page 269 and 270:
• numbers and distribution of liv
- Page 271 and 272:
Using this method of classification
- Page 273 and 274:
Table 5: Results of land use scenar
- Page 275 and 276:
CONCLUSIONS As a decision support t
- Page 277 and 278:
types. This paper reports results f
- Page 279 and 280:
N Losses in Drainage Water Mean nit
- Page 281 and 282:
SOIL AND CROP MANAGEMENT EFFECTS ON
- Page 283 and 284:
treatments, typically 10 storm even
- Page 285 and 286:
Tramline Effects In both years, obs
- Page 287 and 288:
Notes 278