Download as a PDF - CiteSeerX
Download as a PDF - CiteSeerX
Download as a PDF - CiteSeerX

You also want an ePaper? Increase the reach of your titles
YUMPU automatically turns print PDFs into web optimized ePapers that Google loves.
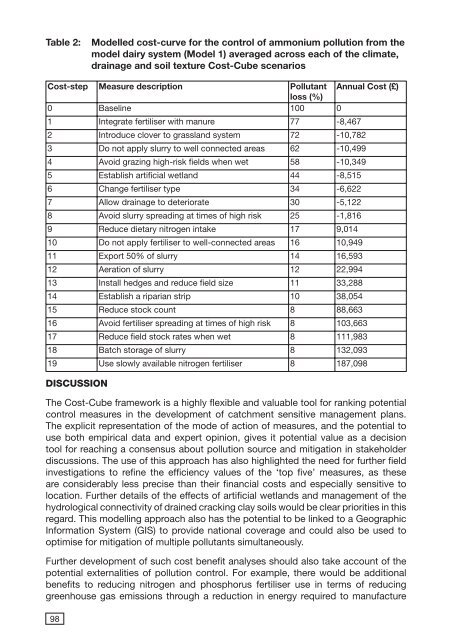
Table 2:<br />
Modelled cost-curve for the control of ammonium pollution from the<br />
model dairy system (Model 1) averaged across each of the climate,<br />
drainage and soil texture Cost-Cube scenarios<br />
Cost-step Me<strong>as</strong>ure description Pollutant Annual Cost (£)<br />
loss (%)<br />
0 B<strong>as</strong>eline 100 0<br />
1 Integrate fertiliser with manure 77 -8,467<br />
2 Introduce clover to gr<strong>as</strong>sland system 72 -10,782<br />
3 Do not apply slurry to well connected are<strong>as</strong> 62 -10,499<br />
4 Avoid grazing high-risk fields when wet 58 -10,349<br />
5 Establish artificial wetland 44 -8,515<br />
6 Change fertiliser type 34 -6,622<br />
7 Allow drainage to deteriorate 30 -5,122<br />
8 Avoid slurry spreading at times of high risk 25 -1,816<br />
9 Reduce dietary nitrogen intake 17 9,014<br />
10 Do not apply fertiliser to well-connected are<strong>as</strong> 16 10,949<br />
11 Export 50% of slurry 14 16,593<br />
12 Aeration of slurry 12 22,994<br />
13 Install hedges and reduce field size 11 33,288<br />
14 Establish a riparian strip 10 38,054<br />
15 Reduce stock count 8 88,663<br />
16 Avoid fertiliser spreading at times of high risk 8 103,663<br />
17 Reduce field stock rates when wet 8 111,983<br />
18 Batch storage of slurry 8 132,093<br />
19 Use slowly available nitrogen fertiliser 8 187,098<br />
DISCUSSION<br />
The Cost-Cube framework is a highly flexible and valuable tool for ranking potential<br />
control me<strong>as</strong>ures in the development of catchment sensitive management plans.<br />
The explicit representation of the mode of action of me<strong>as</strong>ures, and the potential to<br />
use both empirical data and expert opinion, gives it potential value <strong>as</strong> a decision<br />
tool for reaching a consensus about pollution source and mitigation in stakeholder<br />
discussions. The use of this approach h<strong>as</strong> also highlighted the need for further field<br />
investigations to refine the efficiency values of the ‘top five’ me<strong>as</strong>ures, <strong>as</strong> these<br />
are considerably less precise than their financial costs and especially sensitive to<br />
location. Further details of the effects of artificial wetlands and management of the<br />
hydrological connectivity of drained cracking clay soils would be clear priorities in this<br />
regard. This modelling approach also h<strong>as</strong> the potential to be linked to a Geographic<br />
Information System (GIS) to provide national coverage and could also be used to<br />
optimise for mitigation of multiple pollutants simultaneously.<br />
Further development of such cost benefit analyses should also take account of the<br />
potential externalities of pollution control. For example, there would be additional<br />
benefits to reducing nitrogen and phosphorus fertiliser use in terms of reducing<br />
greenhouse g<strong>as</strong> emissions through a reduction in energy required to manufacture<br />
98