Review of the Registered Clubs Industry in NSW - Clubs NSW
Review of the Registered Clubs Industry in NSW - Clubs NSW
Review of the Registered Clubs Industry in NSW - Clubs NSW

Create successful ePaper yourself
Turn your PDF publications into a flip-book with our unique Google optimized e-Paper software.
6 Streng<strong>the</strong>n<strong>in</strong>g <strong>the</strong> f<strong>in</strong>ancial viability <strong>of</strong> <strong>the</strong> registered<br />
clubs <strong>in</strong>dustry<br />
6.1.4 The level <strong>of</strong> f<strong>in</strong>ancial viability among <strong>in</strong>dividual clubs varies widely<br />
Evidence presented to IPART <strong>in</strong> submissions and roundtables (and borne out by<br />
IPART’s <strong>in</strong>vestigations <strong>of</strong> case study clubs) <strong>in</strong>dicates that <strong>the</strong> f<strong>in</strong>ancial health <strong>of</strong><br />
<strong>in</strong>dividual registered clubs varies significantly. Some are very pr<strong>of</strong>itable, o<strong>the</strong>rs are<br />
marg<strong>in</strong>ally pr<strong>of</strong>itable, and some face serious viability issues <strong>in</strong> both <strong>the</strong> short and<br />
long term.<br />
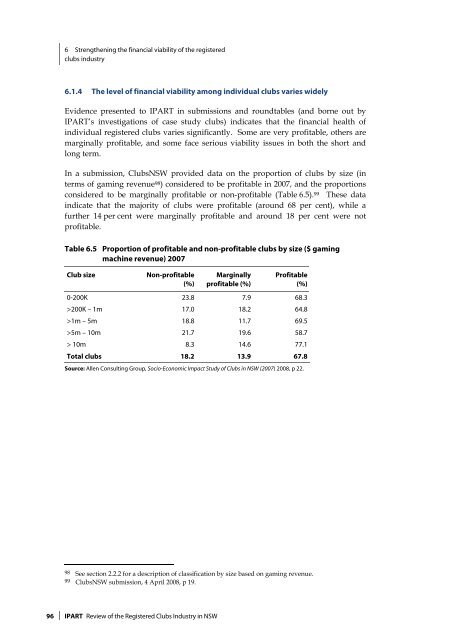
In a submission, <strong>Clubs</strong><strong>NSW</strong> provided data on <strong>the</strong> proportion <strong>of</strong> clubs by size (<strong>in</strong><br />
terms <strong>of</strong> gam<strong>in</strong>g revenue 98 ) considered to be pr<strong>of</strong>itable <strong>in</strong> 2007, and <strong>the</strong> proportions<br />
considered to be marg<strong>in</strong>ally pr<strong>of</strong>itable or non-pr<strong>of</strong>itable (Table 6.5). 99 These data<br />
<strong>in</strong>dicate that <strong>the</strong> majority <strong>of</strong> clubs were pr<strong>of</strong>itable (around 68 per cent), while a<br />
fur<strong>the</strong>r 14 per cent were marg<strong>in</strong>ally pr<strong>of</strong>itable and around 18 per cent were not<br />
pr<strong>of</strong>itable.<br />
Table 6.5 Proportion <strong>of</strong> pr<strong>of</strong>itable and non-pr<strong>of</strong>itable clubs by size ($ gam<strong>in</strong>g<br />
mach<strong>in</strong>e revenue) 2007<br />
Club size<br />
Non-pr<strong>of</strong>itable<br />
(%)<br />
Marg<strong>in</strong>ally<br />
pr<strong>of</strong>itable (%)<br />
Pr<strong>of</strong>itable<br />
(%)<br />
0-200K 23.8 7.9 68.3<br />
>200K – 1m 17.0 18.2 64.8<br />
>1m – 5m 18.8 11.7 69.5<br />
>5m – 10m 21.7 19.6 58.7<br />
> 10m 8.3 14.6 77.1<br />
Total clubs 18.2 13.9 67.8<br />
Source: Allen Consult<strong>in</strong>g Group, Socio-Economic Impact Study <strong>of</strong> <strong>Clubs</strong> <strong>in</strong> <strong>NSW</strong> (2007) 2008, p 22.<br />
98 See section 2.2.2 for a description <strong>of</strong> classification by size based on gam<strong>in</strong>g revenue.<br />
99 <strong>Clubs</strong><strong>NSW</strong> submission, 4 April 2008, p 19.<br />
96 IPART <strong>Review</strong> <strong>of</strong> <strong>the</strong> <strong>Registered</strong> <strong>Clubs</strong> <strong>Industry</strong> <strong>in</strong> <strong>NSW</strong>