Review of the Registered Clubs Industry in NSW - Clubs NSW
Review of the Registered Clubs Industry in NSW - Clubs NSW
Review of the Registered Clubs Industry in NSW - Clubs NSW

Create successful ePaper yourself
Turn your PDF publications into a flip-book with our unique Google optimized e-Paper software.
D Gambl<strong>in</strong>g expenditure and problem gambl<strong>in</strong>g <strong>in</strong><br />
Australia<br />
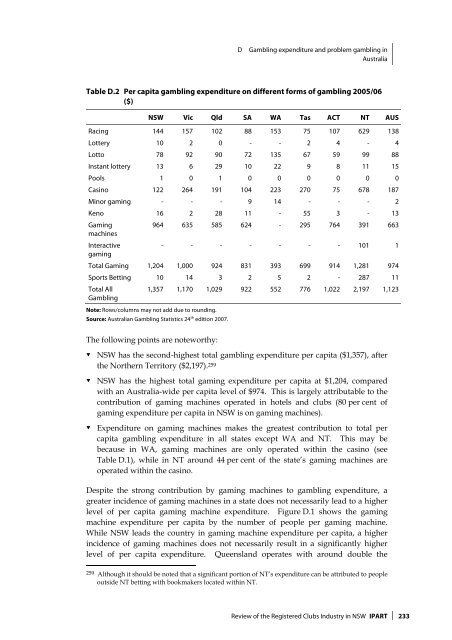
Table D.2 Per capita gambl<strong>in</strong>g expenditure on different forms <strong>of</strong> gambl<strong>in</strong>g 2005/06<br />
($)<br />
<strong>NSW</strong> Vic Qld SA WA Tas ACT NT AUS<br />
Rac<strong>in</strong>g 144 157 102 88 153 75 107 629 138<br />
Lottery 10 2 0 - - 2 4 - 4<br />
Lotto 78 92 90 72 135 67 59 99 88<br />
Instant lottery 13 6 29 10 22 9 8 11 15<br />
Pools 1 0 1 0 0 0 0 0 0<br />
Cas<strong>in</strong>o 122 264 191 104 223 270 75 678 187<br />
M<strong>in</strong>or gam<strong>in</strong>g - - - 9 14 - - - 2<br />
Keno 16 2 28 11 - 55 3 - 13<br />
Gam<strong>in</strong>g<br />
964 635 585 624 - 295 764 391 663<br />
mach<strong>in</strong>es<br />
Interactive<br />
- - - - - - - 101 1<br />
gam<strong>in</strong>g<br />
Total Gam<strong>in</strong>g 1,204 1,000 924 831 393 699 914 1,281 974<br />
Sports Bett<strong>in</strong>g 10 14 3 2 5 2 - 287 11<br />
Total All<br />
Gambl<strong>in</strong>g<br />
1,357 1,170 1,029 922 552 776 1,022 2,197 1,123<br />
Note: Rows/columns may not add due to round<strong>in</strong>g.<br />
Source: Australian Gambl<strong>in</strong>g Statistics 24 th edition 2007.<br />
The follow<strong>in</strong>g po<strong>in</strong>ts are noteworthy:<br />
<br />
<br />
<br />
<strong>NSW</strong> has <strong>the</strong> second-highest total gambl<strong>in</strong>g expenditure per capita ($1,357), after<br />
<strong>the</strong> Nor<strong>the</strong>rn Territory ($2,197). 259<br />
<strong>NSW</strong> has <strong>the</strong> highest total gam<strong>in</strong>g expenditure per capita at $1,204, compared<br />
with an Australia-wide per capita level <strong>of</strong> $974. This is largely attributable to <strong>the</strong><br />
contribution <strong>of</strong> gam<strong>in</strong>g mach<strong>in</strong>es operated <strong>in</strong> hotels and clubs (80 per cent <strong>of</strong><br />
gam<strong>in</strong>g expenditure per capita <strong>in</strong> <strong>NSW</strong> is on gam<strong>in</strong>g mach<strong>in</strong>es).<br />
Expenditure on gam<strong>in</strong>g mach<strong>in</strong>es makes <strong>the</strong> greatest contribution to total per<br />
capita gambl<strong>in</strong>g expenditure <strong>in</strong> all states except WA and NT. This may be<br />
because <strong>in</strong> WA, gam<strong>in</strong>g mach<strong>in</strong>es are only operated with<strong>in</strong> <strong>the</strong> cas<strong>in</strong>o (see<br />
Table D.1), while <strong>in</strong> NT around 44 per cent <strong>of</strong> <strong>the</strong> state’s gam<strong>in</strong>g mach<strong>in</strong>es are<br />
operated with<strong>in</strong> <strong>the</strong> cas<strong>in</strong>o.<br />
Despite <strong>the</strong> strong contribution by gam<strong>in</strong>g mach<strong>in</strong>es to gambl<strong>in</strong>g expenditure, a<br />
greater <strong>in</strong>cidence <strong>of</strong> gam<strong>in</strong>g mach<strong>in</strong>es <strong>in</strong> a state does not necessarily lead to a higher<br />
level <strong>of</strong> per capita gam<strong>in</strong>g mach<strong>in</strong>e expenditure. Figure D.1 shows <strong>the</strong> gam<strong>in</strong>g<br />
mach<strong>in</strong>e expenditure per capita by <strong>the</strong> number <strong>of</strong> people per gam<strong>in</strong>g mach<strong>in</strong>e.<br />
While <strong>NSW</strong> leads <strong>the</strong> country <strong>in</strong> gam<strong>in</strong>g mach<strong>in</strong>e expenditure per capita, a higher<br />
<strong>in</strong>cidence <strong>of</strong> gam<strong>in</strong>g mach<strong>in</strong>es does not necessarily result <strong>in</strong> a significantly higher<br />
level <strong>of</strong> per capita expenditure. Queensland operates with around double <strong>the</strong><br />
259 Although it should be noted that a significant portion <strong>of</strong> NT’s expenditure can be attributed to people<br />
outside NT bett<strong>in</strong>g with bookmakers located with<strong>in</strong> NT.<br />
<strong>Review</strong> <strong>of</strong> <strong>the</strong> <strong>Registered</strong> <strong>Clubs</strong> <strong>Industry</strong> <strong>in</strong> <strong>NSW</strong> IPART 233