Review of the Registered Clubs Industry in NSW - Clubs NSW
Review of the Registered Clubs Industry in NSW - Clubs NSW
Review of the Registered Clubs Industry in NSW - Clubs NSW

You also want an ePaper? Increase the reach of your titles
YUMPU automatically turns print PDFs into web optimized ePapers that Google loves.
D Gambl<strong>in</strong>g expenditure and problem gambl<strong>in</strong>g <strong>in</strong><br />
Australia<br />
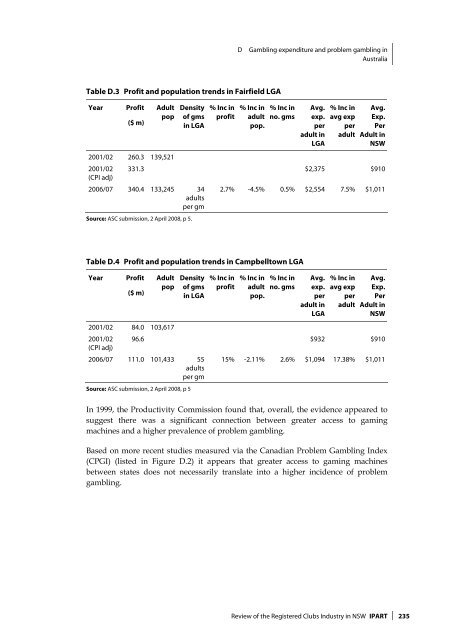
Table D.3 Pr<strong>of</strong>it and population trends <strong>in</strong> Fairfield LGA<br />
Year<br />
Pr<strong>of</strong>it<br />
($ m)<br />
Adult<br />
pop<br />
Density<br />
<strong>of</strong> gms<br />
<strong>in</strong> LGA<br />
% Inc <strong>in</strong><br />
pr<strong>of</strong>it<br />
% Inc <strong>in</strong><br />
adult<br />
pop.<br />
% Inc <strong>in</strong><br />
no. gms<br />
Avg.<br />
exp.<br />
per<br />
adult <strong>in</strong><br />
LGA<br />
% Inc <strong>in</strong><br />
avg exp<br />
per<br />
adult<br />
Avg.<br />
Exp.<br />
Per<br />
Adult <strong>in</strong><br />
<strong>NSW</strong><br />
2001/02 260.3 139,521<br />
2001/02 331.3 $2,375 $910<br />
(CPI adj)<br />
2006/07 340.4 133,245 34<br />
adults<br />
per gm<br />
2.7% -4.5% 0.5% $2,554 7.5% $1,011<br />
Source: ASC submission, 2 April 2008, p 5.<br />
Table D.4 Pr<strong>of</strong>it and population trends <strong>in</strong> Campbelltown LGA<br />
Year<br />
Pr<strong>of</strong>it<br />
($ m)<br />
Adult<br />
pop<br />
Density<br />
<strong>of</strong> gms<br />
<strong>in</strong> LGA<br />
% Inc <strong>in</strong><br />
pr<strong>of</strong>it<br />
% Inc <strong>in</strong><br />
adult<br />
pop.<br />
% Inc <strong>in</strong><br />
no. gms<br />
Avg.<br />
exp.<br />
per<br />
adult <strong>in</strong><br />
LGA<br />
% Inc <strong>in</strong><br />
avg exp<br />
per<br />
adult<br />
Avg.<br />
Exp.<br />
Per<br />
Adult <strong>in</strong><br />
<strong>NSW</strong><br />
2001/02 84.0 103,617<br />
2001/02 96.6 $932 $910<br />
(CPI adj)<br />
2006/07 111.0 101,433 55<br />
adults<br />
per gm<br />
15% -2.11% 2.6% $1,094 17.38% $1,011<br />
Source: ASC submission, 2 April 2008, p 5<br />
In 1999, <strong>the</strong> Productivity Commission found that, overall, <strong>the</strong> evidence appeared to<br />
suggest <strong>the</strong>re was a significant connection between greater access to gam<strong>in</strong>g<br />
mach<strong>in</strong>es and a higher prevalence <strong>of</strong> problem gambl<strong>in</strong>g.<br />
Based on more recent studies measured via <strong>the</strong> Canadian Problem Gambl<strong>in</strong>g Index<br />
(CPGI) (listed <strong>in</strong> Figure D.2) it appears that greater access to gam<strong>in</strong>g mach<strong>in</strong>es<br />
between states does not necessarily translate <strong>in</strong>to a higher <strong>in</strong>cidence <strong>of</strong> problem<br />
gambl<strong>in</strong>g.<br />
<strong>Review</strong> <strong>of</strong> <strong>the</strong> <strong>Registered</strong> <strong>Clubs</strong> <strong>Industry</strong> <strong>in</strong> <strong>NSW</strong> IPART 235