Tulsa Comprehensive Plan - PLANiTULSA
Tulsa Comprehensive Plan - PLANiTULSA
Tulsa Comprehensive Plan - PLANiTULSA

You also want an ePaper? Increase the reach of your titles
YUMPU automatically turns print PDFs into web optimized ePapers that Google loves.
Transportation<br />
PArT I: Vision anD ChaLLEnGEs<br />
destinations. The <strong>PLANiTULSA</strong> team tested these<br />
types of investments to assure <strong>Tulsa</strong> has an effective and<br />
durable transportation system that works for today’s<br />
users while fostering a future system that is sustainable<br />
and offers more travel options.<br />
Using future population and employment estimates<br />
from the <strong>Tulsa</strong> 2030 Goal, one can model the<br />
transportation system and plan for future infrastructure<br />
needs. In <strong>Tulsa</strong>, the best model for performing this<br />
analysis is INCOG’s Travel Demand Model. It was<br />
developed to evaluate transportation projects for the<br />
entire <strong>Tulsa</strong> Region and includes a current year road<br />
network and demographics (2005) as well as a forecast<br />
year (2030) road network and demographic factors.<br />
The INCOG model uses specific “mode choice”<br />
algorithms to convert person-trips to vehicle-trips. The<br />
<strong>PLANiTULSA</strong> team expanded that process to estimate<br />
how people would react to new walkable land use forms<br />
and an expanded transit and multi-modal system.<br />
To accomplish this we employ a process called the<br />
elasticity method for measuring the impact of the 5Ds,<br />
(Density, Diversity, Design, Destinations, Distance).<br />
This process allows for additional refinement during<br />
the “mode choice” step to estimate transit and mixeduse<br />
trip capture.<br />
The model identifies a number of indicators that can<br />
be used to evaluate the performance and effciency of<br />
different scenarios. The following section summarizes<br />
the major indicators derived from the transportation<br />
model and illustrate how diversifying transportation<br />
investments will help implement Our Vision for <strong>Tulsa</strong>.<br />
<strong>Tulsa</strong> 2030 Goal<br />
Indicators and Analysis<br />
The analysis began with researching the benefits of<br />
<strong>Tulsa</strong> 2030 Goal, which uses a strategy of reducing the<br />
amount of additional roadway lane miles and increases<br />
housing and employment densities in strategic corridors<br />
and around transit stations.<br />
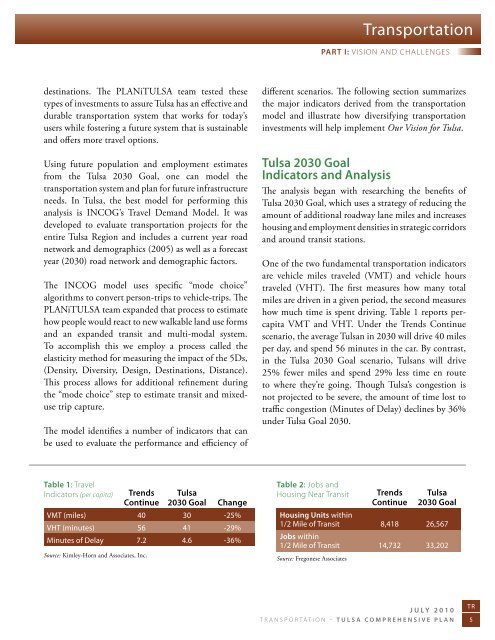
One of the two fundamental transportation indicators<br />
are vehicle miles traveled (VMT) and vehicle hours<br />
traveled (VHT). The first measures how many total<br />
miles are driven in a given period, the second measures<br />
how much time is spent driving. Table 1 reports percapita<br />
VMT and VHT. Under the Trends Continue<br />
scenario, the average <strong>Tulsa</strong>n in 2030 will drive 40 miles<br />
per day, and spend 56 minutes in the car. By contrast,<br />
in the <strong>Tulsa</strong> 2030 Goal scenario, <strong>Tulsa</strong>ns will drive<br />
25% fewer miles and spend 29% less time en route<br />
to where they’re going. Though <strong>Tulsa</strong>’s congestion is<br />
not projected to be severe, the amount of time lost to<br />
traffc congestion (Minutes of Delay) declines by 36%<br />
under <strong>Tulsa</strong> Goal 2030.<br />
Table 1: travel<br />
Table 2: Jobs and<br />
indicators (per capita) Trends <strong>Tulsa</strong> housing near transit Trends <strong>Tulsa</strong><br />
Continue 2030 Goal Change Continue 2030 Goal<br />
VMT (miles) 40 30 -25%<br />
VHT (minutes) 56 41 -29%<br />
Minutes of Delay 7.2 4.6 -36%<br />
Source: Kimley-Horn and Associates, Inc.<br />
Housing Units within<br />
1/2 Mile of Transit 8,418 26,567<br />
Jobs within<br />
1/2 Mile of Transit 14,732 33,202<br />
Source: Fregonese Associates<br />
July 2010<br />
TR<br />
transportation – <strong>Tulsa</strong> comprehensive plan 5