Tulsa Comprehensive Plan - PLANiTULSA
Tulsa Comprehensive Plan - PLANiTULSA
Tulsa Comprehensive Plan - PLANiTULSA

You also want an ePaper? Increase the reach of your titles
YUMPU automatically turns print PDFs into web optimized ePapers that Google loves.
Land Use<br />
parT v: BUiLdinG THe PLan<br />
land use plan Build-out capacity<br />
In addition to <strong>Tulsa</strong> 2030 Goal, the <strong>PLANiTULSA</strong><br />
team developed a long-range estimate of the total<br />
build-out capacity of <strong>Tulsa</strong>’s new comprehensive plan.<br />
It is based on the land use plan categories outlined<br />
above and illustrates how these different environments<br />
can contribute to <strong>Tulsa</strong>’s overall shape and form.<br />
Existing neighborhoods were not included in this<br />
analysis, with the assumption that they will not absorb<br />
large amounts of growth. Unconstrained buildable<br />
lands were assumed to develop in their entirety, while<br />
redevelopment lands were assumed to redevelop at a<br />
20% rate, a fairly conservative figure. Floodplains were<br />
assumed to develop at 50%, assuming engineering and<br />
mitigation is used.<br />
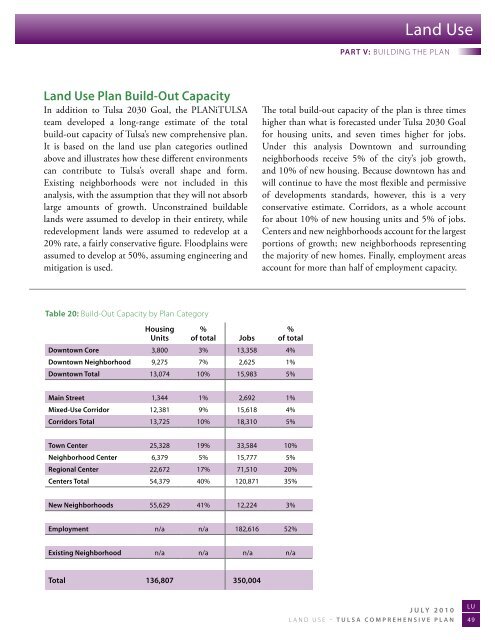
The total build-out capacity of the plan is three times<br />
higher than what is forecasted under <strong>Tulsa</strong> 2030 Goal<br />
for housing units, and seven times higher for jobs.<br />
Under this analysis Downtown and surrounding<br />
neighborhoods receive 5% of the city’s job growth,<br />
and 10% of new housing. Because downtown has and<br />
will continue to have the most flexible and permissive<br />
of developments standards, however, this is a very<br />
conservative estimate. Corridors, as a whole account<br />
for about 10% of new housing units and 5% of jobs.<br />
Centers and new neighborhoods account for the largest<br />
portions of growth; new neighborhoods representing<br />
the majority of new homes. Finally, employment areas<br />
account for more than half of employment capacity.<br />
Table 20: Build-Out Capacity by <strong>Plan</strong> Category<br />
housing % %<br />
units of total Jobs of total<br />
downtown core 3,800 3% 13,358 4%<br />
downtown neighborhood 9,275 7% 2,625 1%<br />
downtown Total 13,074 10% 15,983 5%<br />
main street 1,344 1% 2,692 1%<br />
mixed-use corridor 12,381 9% 15,618 4%<br />
corridors Total 13,725 10% 18,310 5%<br />
Town center 25,328 19% 33,584 10%<br />
neighborhood center 6,379 5% 15,777 5%<br />
regional center 22,672 17% 71,510 20%<br />
centers Total 54,379 40% 120,871 35%<br />
new neighborhoods 55,629 41% 12,224 3%<br />
employment n/a n/a 182,616 52%<br />
existing neighborhood n/a n/a n/a n/a<br />
Total 136,807 350,004<br />
July 2010<br />
LU<br />
Land Use – <strong>Tulsa</strong> comprehensive plan 49