Tulsa Comprehensive Plan - PLANiTULSA
Tulsa Comprehensive Plan - PLANiTULSA
Tulsa Comprehensive Plan - PLANiTULSA

Create successful ePaper yourself
Turn your PDF publications into a flip-book with our unique Google optimized e-Paper software.
Economic development<br />
parT i: AnAlySiS & FindinGS<br />
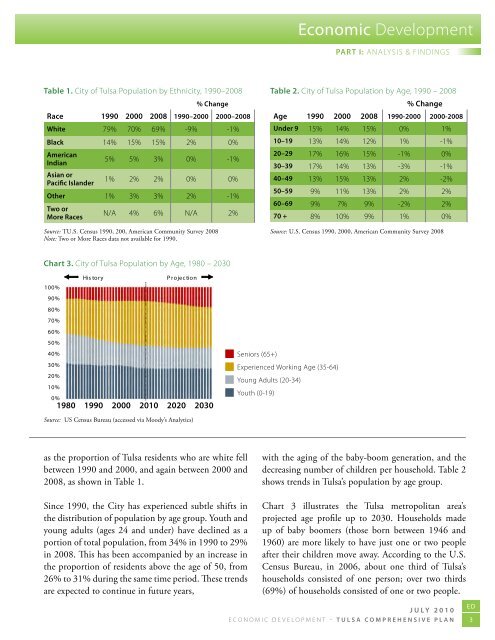
Table 1. city of tulsa population by ethnicity, 1990–2008 Table 2. city of tulsa population by Age, 1990 – 2008<br />
race 1990 2000 2008 1990–2000 2000–2008<br />
White 79% 70% 69% -9% -1%<br />
Black 14% 15% 15% 2% 0%<br />
american<br />
indian<br />
asian or<br />
pacific islander<br />
5% 5% 3% 0% -1%<br />
1% 2% 2% 0% 0%<br />
other 1% 3% 3% 2% -1%<br />
Two or<br />
more races<br />
n/A 4% 6% n/A 2%<br />
% change % change<br />
age 1990 2000 2008 1990-2000 2000-2008<br />
under 9 15% 14% 15% 0% 1%<br />
10–19 13% 14% 12% 1% -1%<br />
20–29 17% 16% 15% -1% 0%<br />
30–39 17% 14% 13% -3% -1%<br />
40–49 13% 15% 13% 2% -2%<br />
50–59 9% 11% 13% 2% 2%<br />
60–69 9% 7% 9% -2% 2%<br />
70 + 8% 10% 9% 1% 0%<br />
Source: TU.S. Census 1990, 200, American Community Survey 2008<br />
Note: Two or More Races data not available for 1990.<br />
Source: U.S. Census 1990, 2000, American Community Survey 2008<br />
chart 3. city of tulsa population by Age, 1980 – 2030<br />
His tory<br />
P rojec tion<br />
100%<br />
90%<br />
S eniors (65+)<br />
80%<br />
70%<br />
E xperienced W orking Age (35-64)<br />
60%<br />
50%<br />
40%<br />
Young Seniors Adults (20-34) (65+)<br />
30%<br />
experienced Working Age (35-64)<br />
20%<br />
young Adults (20-34)<br />
Youth 10%<br />
(0-19)<br />
youth (0-19)<br />
0%<br />
1980 1990 2000 2010 2020 2030<br />
Source: US Census Bureau (accessed via Moody’s Analytics)<br />
as the proportion of <strong>Tulsa</strong> residents who are white fell<br />
between 1990 and 2000, and again between 2000 and<br />
2008, as shown in Table 1.<br />
Since 1990, the City has experienced subtle shifts in<br />
the distribution of population by age group. Youth and<br />
young adults (ages 24 and under) have declined as a<br />
portion of total population, from 34% in 1990 to 29%<br />
in 2008. This has been accompanied by an increase in<br />
the proportion of residents above the age of 50, from<br />
26% to 31% during the same time period. These trends<br />
are expected to continue in future years,<br />
with the aging of the baby-boom generation, and the<br />
decreasing number of children per household. Table 2<br />
shows trends in <strong>Tulsa</strong>’s population by age group.<br />
Chart 3 illustrates the <strong>Tulsa</strong> metropolitan area’s<br />
projected age profile up to 2030. Households made<br />
up of baby boomers (those born between 1946 and<br />
1960) are more likely to have just one or two people<br />
after their children move away. According to the U.S.<br />
Census Bureau, in 2006, about one third of <strong>Tulsa</strong>’s<br />
households consisted of one person; over two thirds<br />
(69%) of households consisted of one or two people.<br />
July 2010<br />
ED<br />
economic development – <strong>Tulsa</strong> comprehensive plan 3