Tulsa Comprehensive Plan - PLANiTULSA
Tulsa Comprehensive Plan - PLANiTULSA
Tulsa Comprehensive Plan - PLANiTULSA

You also want an ePaper? Increase the reach of your titles
YUMPU automatically turns print PDFs into web optimized ePapers that Google loves.
Land Use<br />
parT v: BUiLdinG THe PLan<br />
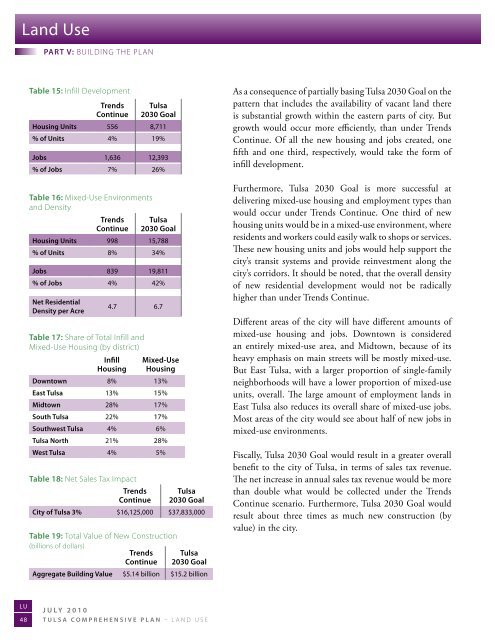
Table 15: infill development<br />
Trends<br />
continue<br />
<strong>Tulsa</strong><br />
2030 goal<br />
housing units 556 8,711<br />
% of units 4% 19%<br />
Jobs 1,636 12,393<br />
% of Jobs 7% 26%<br />
Table 16: Mixed-Use environments<br />
and density<br />
Trends<br />
continue<br />
<strong>Tulsa</strong><br />
2030 goal<br />
housing units 998 15,788<br />
% of units 8% 34%<br />
Jobs 839 19,811<br />
% of Jobs 4% 42%<br />
net residential<br />
density per acre<br />
4.7 6.7<br />
Table 17: share of Total infill and<br />
Mixed-Use Housing (by district)<br />
infill<br />
housing<br />
mixed-use<br />
housing<br />
downtown 8% 13%<br />
east <strong>Tulsa</strong> 13% 15%<br />
midtown 28% 17%<br />
south <strong>Tulsa</strong> 22% 17%<br />
southwest <strong>Tulsa</strong> 4% 6%<br />
<strong>Tulsa</strong> north 21% 28%<br />
West <strong>Tulsa</strong> 4% 5%<br />
Table 18: net sales Tax impact<br />
Trends<br />
continue<br />
<strong>Tulsa</strong><br />
2030 goal<br />
city of <strong>Tulsa</strong> 3% $16,125,000 $37,833,000<br />
Table 19: Total Value of new Construction<br />
(billions of dollars)<br />
Trends <strong>Tulsa</strong><br />
continue 2030 goal<br />
aggregate Building value $5.14 billion $15.2 billion<br />
As a consequence of partially basing <strong>Tulsa</strong> 2030 Goal on the<br />
pattern that includes the availability of vacant land there<br />
is substantial growth within the eastern parts of city. But<br />
growth would occur more effciently, than under Trends<br />
Continue. Of all the new housing and jobs created, one<br />
fifth and one third, respectively, would take the form of<br />
infill development.<br />
Furthermore, <strong>Tulsa</strong> 2030 Goal is more successful at<br />
delivering mixed-use housing and employment types than<br />
would occur under Trends Continue. One third of new<br />
housing units would be in a mixed-use environment, where<br />
residents and workers could easily walk to shops or services.<br />
These new housing units and jobs would help support the<br />
city’s transit systems and provide reinvestment along the<br />
city’s corridors. It should be noted, that the overall density<br />
of new residential development would not be radically<br />
higher than under Trends Continue.<br />
Different areas of the city will have different amounts of<br />
mixed-use housing and jobs. Downtown is considered<br />
an entirely mixed-use area, and Midtown, because of its<br />
heavy emphasis on main streets will be mostly mixed-use.<br />
But East <strong>Tulsa</strong>, with a larger proportion of single-family<br />
neighborhoods will have a lower proportion of mixed-use<br />
units, overall. The large amount of employment lands in<br />
East <strong>Tulsa</strong> also reduces its overall share of mixed-use jobs.<br />
Most areas of the city would see about half of new jobs in<br />
mixed-use environments.<br />
Fiscally, <strong>Tulsa</strong> 2030 Goal would result in a greater overall<br />
benefit to the city of <strong>Tulsa</strong>, in terms of sales tax revenue.<br />
The net increase in annual sales tax revenue would be more<br />
than double what would be collected under the Trends<br />
Continue scenario. Furthermore, <strong>Tulsa</strong> 2030 Goal would<br />
result about three times as much new construction (by<br />
value) in the city.<br />
LU<br />
48<br />
July 2010<br />
<strong>Tulsa</strong> comprehensive plan – Land Use