Tulsa Comprehensive Plan - PLANiTULSA
Tulsa Comprehensive Plan - PLANiTULSA
Tulsa Comprehensive Plan - PLANiTULSA

Create successful ePaper yourself
Turn your PDF publications into a flip-book with our unique Google optimized e-Paper software.
Transportation<br />
PArT I: Vision anD ChaLLEnGEs<br />
One of the key drivers of this improvement would be<br />
the location of more total homes and jobs near transit,<br />
both in new communities and from improved service to<br />
existing neighborhoods (Table 2). The <strong>PLANiTULSA</strong><br />
public input process indicated a desire for greater<br />
transit options, both through the workshop process<br />
and the scenario survey.<br />
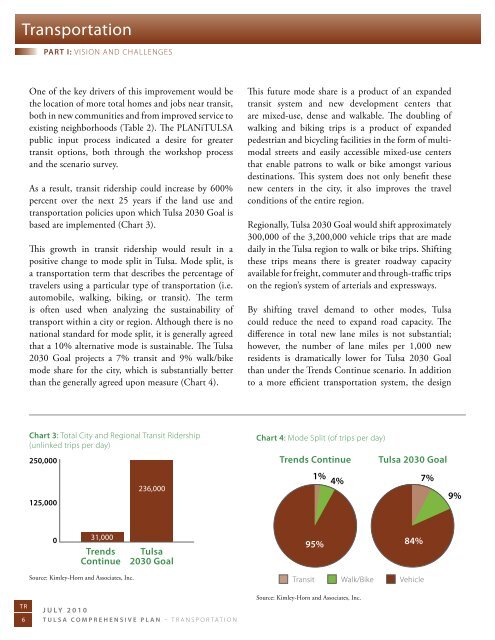
As a result, transit ridership could increase by 600%<br />
percent over the next 25 years if the land use and<br />
transportation policies upon which <strong>Tulsa</strong> 2030 Goal is<br />
based are implemented (Chart 3).<br />
This growth in transit ridership would result in a<br />
positive change to mode split in <strong>Tulsa</strong>. Mode split, is<br />
a transportation term that describes the percentage of<br />
travelers using a particular type of transportation (i.e.<br />
automobile, walking, biking, or transit). The term<br />
is often used when analyzing the sustainability of<br />
transport within a city or region. Although there is no<br />
national standard for mode split, it is generally agreed<br />
that a 10% alternative mode is sustainable. The <strong>Tulsa</strong><br />
2030 Goal projects a 7% transit and 9% walk/bike<br />
mode share for the city, which is substantially better<br />
than the generally agreed upon measure (Chart 4).<br />
This future mode share is a product of an expanded<br />
transit system and new development centers that<br />
are mixed-use, dense and walkable. The doubling of<br />
walking and biking trips is a product of expanded<br />
pedestrian and bicycling facilities in the form of multimodal<br />
streets and easily accessible mixed-use centers<br />
that enable patrons to walk or bike amongst various<br />
destinations. This system does not only benefit these<br />
new centers in the city, it also improves the travel<br />
conditions of the entire region.<br />
Regionally, <strong>Tulsa</strong> 2030 Goal would shift approximately<br />
300,000 of the 3,200,000 vehicle trips that are made<br />
daily in the <strong>Tulsa</strong> region to walk or bike trips. Shifting<br />
these trips means there is greater roadway capacity<br />
available for freight, commuter and through-traffc trips<br />
on the region’s system of arterials and expressways.<br />
By shifting travel demand to other modes, <strong>Tulsa</strong><br />
could reduce the need to expand road capacity. The<br />
difference in total new lane miles is not substantial;<br />
however, the number of lane miles per 1,000 new<br />
residents is dramatically lower for <strong>Tulsa</strong> 2030 Goal<br />
than under the Trends Continue scenario. In addition<br />
to a more effcient transportation system, the design<br />
Chart 3: total City and regional transit ridership<br />
(unlinked trips per day)<br />
250,000<br />
236,000<br />
125,000<br />
Chart 4: Mode split (of trips per day)<br />
Trends Continue <strong>Tulsa</strong> 2030 Goal<br />
1% 4% 7%<br />
9%<br />
0<br />
31,000<br />
Trends <strong>Tulsa</strong> <br />
Continue 2030 Goal<br />
95% 84%<br />
Source: Kimley-Horn and Associates, Inc. transit Walk/Bike Vehicle<br />
TR<br />
6<br />
July 2010<br />
<strong>Tulsa</strong> comprehensive plan – transportation<br />
Source: Kimley-Horn and Associates, Inc.