Tulsa Comprehensive Plan - PLANiTULSA
Tulsa Comprehensive Plan - PLANiTULSA
Tulsa Comprehensive Plan - PLANiTULSA

You also want an ePaper? Increase the reach of your titles
YUMPU automatically turns print PDFs into web optimized ePapers that Google loves.
Housing<br />
Housing<br />
part i:<br />
<strong>Tulsa</strong>’s Housing Today<br />
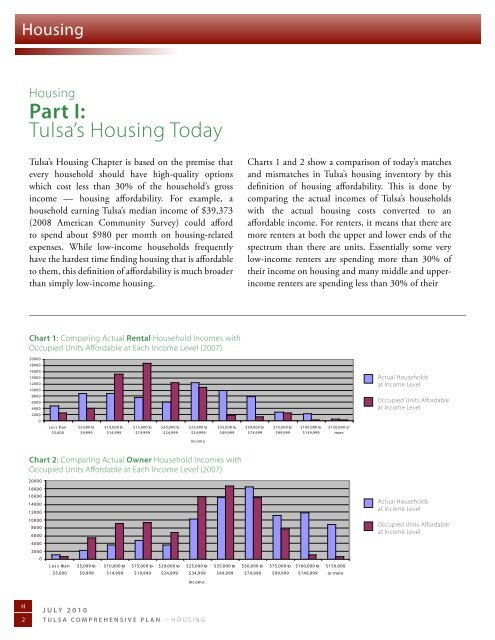
<strong>Tulsa</strong>’s Housing Chapter is based on the premise that<br />
every household should have high-quality options<br />
which cost less than 30% of the household’s gross<br />
income — housing affordability. For example, a<br />
household earning <strong>Tulsa</strong>’s median income of $39,373<br />
(2008 American Community Survey) could afford<br />
to spend about $980 per month on housing-related<br />
expenses. While low-income households frequently<br />
have the hardest time finding housing that is affordable<br />
to them, this definition of affordability is much broader<br />
than simply low-income housing.<br />
Charts 1 and 2 show a comparison of today’s matches<br />
and mismatches in <strong>Tulsa</strong>’s housing inventory by this<br />
definition of housing affordability. This is done by<br />
comparing the actual incomes of <strong>Tulsa</strong>’s households<br />
with the actual housing costs converted to an<br />
affordable income. For renters, it means that there are<br />
more renters at both the upper and lower ends of the<br />
spectrum than there are units. Essentially some very<br />
low-income renters are spending more than 30% of<br />
their income on housing and many middle and upperincome<br />
renters are spending less than 30% of their<br />
chart 1: Comparing Actual rental Household incomes with<br />
occupied units Affordable at Each income Level (2007)<br />
20000<br />
18000<br />
16000<br />
14000<br />
12000<br />
10000<br />
Units<br />
8000<br />
6000<br />
4000<br />
2000<br />
0<br />
Comparing ActualR entalHouseholdIncomes with OccupiedUnits Affordable at Each Income Level(2007)<br />
L es s tha n $5,000 to $10,000 to $15,000 to $20,000 to $25,000 to $35,000 to $50,000 to $75,000 to $100,000 to $150,000 or<br />
$5,000 $9,999 $14,999 $19,999 $24,999 $34,999 $49,999 $74,999 $99,999 $149,999 more<br />
Actual Households<br />
at income Level<br />
occupied units Affordable<br />
at income Level<br />
Inc om e<br />
Co m pa rin g Actu a l O wn e r Ho A cutua se l Hous h oeholds In co a tInc mome e s Lwith ev el OOccu c c upied Units d Un A fits f orda Affo ble arda tInc ome bleL ev a el t E a ch In co m e<br />
chart 2: Comparing Actual owner Household L e ve l (2007) incomes with<br />
occupied units Affordable at Each income Level (2007)<br />
20000<br />
18000<br />
16000<br />
14000<br />
12000<br />
10000<br />
Units<br />
8000<br />
6000<br />
4000<br />
2000<br />
0<br />
L es s tha n $5,000 to $10,000 to $15,000 to $20,000 to $25,000 to $35,000 to $50,000 to $75,000 to $100,000 to $150,000<br />
$5,000 $9,999 $14,999 $19,999 $24,999 $34,999 $49,999 $74,999 $99,999 $149,999 or more<br />
Inc om e<br />
Actual Households<br />
at income Level<br />
occupied units Affordable<br />
at income Level<br />
H<br />
2<br />
A c tua l Hous eholds a tInc ome L ev el<br />
July 2010<br />
<strong>Tulsa</strong> comprehensive plan – Housing<br />
O c c upied Units A f f orda ble a tInc ome L ev el