Tulsa Comprehensive Plan - PLANiTULSA
Tulsa Comprehensive Plan - PLANiTULSA
Tulsa Comprehensive Plan - PLANiTULSA

Create successful ePaper yourself
Turn your PDF publications into a flip-book with our unique Google optimized e-Paper software.
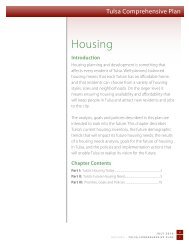
Land Use<br />
parT v: BUiLdinG THe PLan<br />
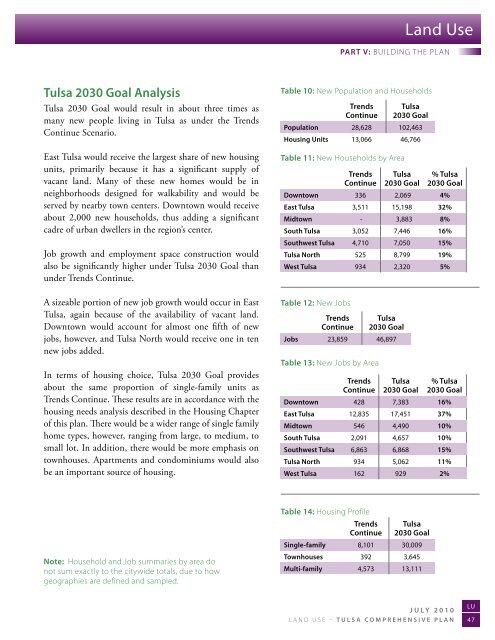
<strong>Tulsa</strong> 2030 goal analysis<br />
<strong>Tulsa</strong> 2030 Goal would result in about three times as<br />
many new people living in <strong>Tulsa</strong> as under the Trends<br />
Continue Scenario.<br />
East <strong>Tulsa</strong> would receive the largest share of new housing<br />
units, primarily because it has a significant supply of<br />
vacant land. Many of these new homes would be in<br />
neighborhoods designed for walkability and would be<br />
served by nearby town centers. Downtown would receive<br />
about 2,000 new households, thus adding a significant<br />
cadre of urban dwellers in the region’s center.<br />
Job growth and employment space construction would<br />
also be significantly higher under <strong>Tulsa</strong> 2030 Goal than<br />
under Trends Continue.<br />
A sizeable portion of new job growth would occur in East<br />
<strong>Tulsa</strong>, again because of the availability of vacant land.<br />
Downtown would account for almost one fifth of new<br />
jobs, however, and <strong>Tulsa</strong> North would receive one in ten<br />
new jobs added.<br />
In terms of housing choice, <strong>Tulsa</strong> 2030 Goal provides<br />
about the same proportion of single-family units as<br />
Trends Continue. These results are in accordance with the<br />
housing needs analysis described in the Housing Chapter<br />
of this plan. There would be a wider range of single family<br />
home types, however, ranging from large, to medium, to<br />
small lot. In addition, there would be more emphasis on<br />
townhouses. Apartments and condominiums would also<br />
be an important source of housing.<br />
Table 10: new Population and Households<br />
Trends<br />
continue<br />
<strong>Tulsa</strong><br />
2030 goal<br />
population 28,628 102,463<br />
housing units 13,066 46,766<br />
Table 11: new Households by area<br />
Trends<br />
continue<br />
<strong>Tulsa</strong><br />
2030 goal<br />
% <strong>Tulsa</strong><br />
2030 goal<br />
downtown 336 2,069 4%<br />
east <strong>Tulsa</strong> 3,511 15,198 32%<br />
midtown 3,883 8%<br />
south <strong>Tulsa</strong> 3,052 7,446 16%<br />
southwest <strong>Tulsa</strong> 4,710 7,050 15%<br />
<strong>Tulsa</strong> north 525 8,799 19%<br />
West <strong>Tulsa</strong> 934 2,320 5%<br />
Table 12: new Jobs<br />
Trends<br />
continue<br />
<strong>Tulsa</strong><br />
2030 goal<br />
Jobs 23,859 46,897<br />
Table 13: new Jobs by area<br />
Trends<br />
continue<br />
<strong>Tulsa</strong><br />
2030 goal<br />
% <strong>Tulsa</strong><br />
2030 goal<br />
downtown 428 7,383 16%<br />
east <strong>Tulsa</strong> 12,835 17,451 37%<br />
midtown 546 4,490 10%<br />
south <strong>Tulsa</strong> 2,091 4,657 10%<br />
southwest <strong>Tulsa</strong> 6,863 6,868 15%<br />
<strong>Tulsa</strong> north 934 5,062 11%<br />
West <strong>Tulsa</strong> 162 929 2%<br />
note: Household and Job summaries by area do<br />
not sum exactly to the citywide totals, due to how<br />
geographies are defined and sampled.<br />
Table 14: Housing Profile<br />
Trends <strong>Tulsa</strong><br />
continue 2030 goal<br />
single-family 8,101 30,009<br />
Townhouses 392 3,645<br />
multi-family 4,573 13,111<br />
July 2010<br />
LU<br />
Land Use – <strong>Tulsa</strong> comprehensive plan 47