Tulsa Comprehensive Plan - PLANiTULSA
Tulsa Comprehensive Plan - PLANiTULSA
Tulsa Comprehensive Plan - PLANiTULSA

You also want an ePaper? Increase the reach of your titles
YUMPU automatically turns print PDFs into web optimized ePapers that Google loves.
Economic development<br />
parT i: AnAlySiS & FindinGS<br />
ED<br />
6<br />
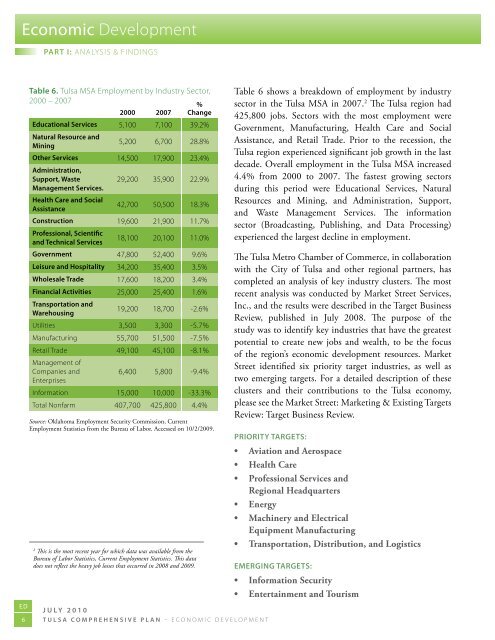
Table 6. tulsa mSA employment by industry Sector,<br />
2000 – 2007<br />
%<br />
2000 2007 change<br />
educational services 5,100 7,100 39.2%<br />
natural resource and<br />
mining<br />
5,200 6,700 28.8%<br />
other services 14,500 17,900 23.4%<br />
administration,<br />
support, Waste<br />
29,200 35,900 22.9%<br />
management services.<br />
health care and social<br />
assistance<br />
42,700 50,500 18.3%<br />
construction 19,600 21,900 11.7%<br />
professional, scientific<br />
and Technical services<br />
18,100 20,100 11.0%<br />
Government 47,800 52,400 9.6%<br />
leisure and hospitality 34,200 35,400 3.5%<br />
Wholesale Trade 17,600 18,200 3.4%<br />
Financial activities 25,000 25,400 1.6%<br />
Transportation and<br />
Warehousing<br />
19,200 18,700 -2.6%<br />
Utilities 3,500 3,300 -5.7%<br />
manufacturing 55,700 51,500 -7.5%<br />
Retail trade 49,100 45,100 -8.1%<br />
management of<br />
companies and<br />
6,400 5,800 -9.4%<br />
enterprises<br />
information 15,000 10,000 -33.3%<br />
total nonfarm 407,700 425,800 4.4%<br />
Source: Oklahoma Employment Security Commission, Current<br />
Employment Statistics from the Bureau of Labor. Accessed on 10/2/2009.<br />
2<br />
This is the most recent year for which data was available from the<br />
Bureau of Labor Statistics, Current Employment Statistics. This data<br />
does not reflect the heavy job losses that occurred in 2008 and 2009.<br />
July 2010<br />
<strong>Tulsa</strong> comprehensive plan – economic development<br />
Table 6 shows a breakdown of employment by industry<br />
sector in the <strong>Tulsa</strong> MSA in 2007. 2 The <strong>Tulsa</strong> region had<br />
425,800 jobs. Sectors with the most employment were<br />
Government, Manufacturing, Health Care and Social<br />
Assistance, and Retail Trade. Prior to the recession, the<br />
<strong>Tulsa</strong> region experienced significant job growth in the last<br />
decade. Overall employment in the <strong>Tulsa</strong> MSA increased<br />
4.4% from 2000 to 2007. The fastest growing sectors<br />
during this period were Educational Services, Natural<br />
Resources and Mining, and Administration, Support,<br />
and Waste Management Services. The information<br />
sector (Broadcasting, Publishing, and Data Processing)<br />
experienced the largest decline in employment.<br />
The <strong>Tulsa</strong> Metro Chamber of Commerce, in collaboration<br />
with the City of <strong>Tulsa</strong> and other regional partners, has<br />
completed an analysis of key industry clusters. The most<br />
recent analysis was conducted by Market Street Services,<br />
Inc., and the results were described in the Target Business<br />
Review, published in July 2008. The purpose of the<br />
study was to identify key industries that have the greatest<br />
potential to create new jobs and wealth, to be the focus<br />
of the region’s economic development resources. Market<br />
Street identified six priority target industries, as well as<br />
two emerging targets. For a detailed description of these<br />
clusters and their contributions to the <strong>Tulsa</strong> economy,<br />
please see the Market Street: Marketing & Existing Targets<br />
Review: Target Business Review.<br />
prioriTy TarGeTs:<br />
• Aviation and Aerospace<br />
• Health Care<br />
• Professional Services and<br />
Regional Headquarters<br />
• Energy<br />
• Machinery and Electrical<br />
Equipment Manufacturing<br />
• Transportation, Distribution, and Logistics<br />
emerGinG TarGeTs:<br />
• Information Security<br />
• Entertainment and Tourism