Tulsa Comprehensive Plan - PLANiTULSA
Tulsa Comprehensive Plan - PLANiTULSA
Tulsa Comprehensive Plan - PLANiTULSA

You also want an ePaper? Increase the reach of your titles
YUMPU automatically turns print PDFs into web optimized ePapers that Google loves.
Transportation<br />
PArT I: Vision anD ChaLLEnGEs<br />
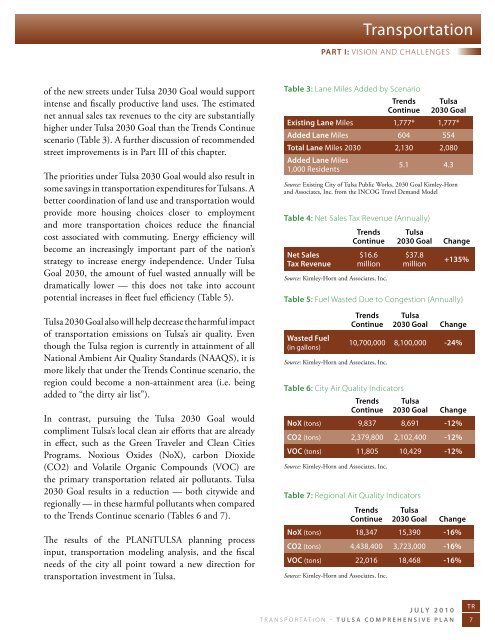
of the new streets under <strong>Tulsa</strong> 2030 Goal would support<br />
intense and fiscally productive land uses. The estimated<br />
net annual sales tax revenues to the city are substantially<br />
higher under <strong>Tulsa</strong> 2030 Goal than the Trends Continue<br />
scenario (Table 3). A further discussion of recommended<br />
street improvements is in Part III of this chapter.<br />
The priorities under <strong>Tulsa</strong> 2030 Goal would also result in<br />
some savings in transportation expenditures for <strong>Tulsa</strong>ns. A<br />
better coordination of land use and transportation would<br />
provide more housing choices closer to employment<br />
and more transportation choices reduce the financial<br />
cost associated with commuting. Energy effciency will<br />
become an increasingly important part of the nation’s<br />
strategy to increase energy independence. Under <strong>Tulsa</strong><br />
Goal 2030, the amount of fuel wasted annually will be<br />
dramatically lower — this does not take into account<br />
potential increases in fleet fuel effciency (Table 5).<br />
<strong>Tulsa</strong> 2030 Goal also will help decrease the harmful impact<br />
of transportation emissions on <strong>Tulsa</strong>’s air quality. Even<br />
though the <strong>Tulsa</strong> region is currently in attainment of all<br />
National Ambient Air Quality Standards (NAAQS), it is<br />
more likely that under the Trends Continue scenario, the<br />
region could become a non-attainment area (i.e. being<br />
added to “the dirty air list”).<br />
In contrast, pursuing the <strong>Tulsa</strong> 2030 Goal would<br />
compliment <strong>Tulsa</strong>’s local clean air efforts that are already<br />
in effect, such as the Green Traveler and Clean Cities<br />
Programs. Noxious Oxides (NoX), carbon Dioxide<br />
(CO2) and Volatile Organic Compounds (VOC) are<br />
the primary transportation related air pollutants. <strong>Tulsa</strong><br />
2030 Goal results in a reduction — both citywide and<br />
regionally — in these harmful pollutants when compared<br />
to the Trends Continue scenario (Tables 6 and 7).<br />
The results of the <strong>PLANiTULSA</strong> planning process<br />
input, transportation modeling analysis, and the fiscal<br />
needs of the city all point toward a new direction for<br />
transportation investment in <strong>Tulsa</strong>.<br />
Table 3: Lane Miles added by scenario<br />
Trends<br />
Continue<br />
<strong>Tulsa</strong> <br />
2030 Goal<br />
Existing Lane Miles 1,777* 1,777*<br />
Added Lane Miles 604 554<br />
Total Lane Miles 2030 2,130 2,080<br />
Added Lane Miles<br />
1,000 Residents<br />
5.1 4.3<br />
Source: Existing City of <strong>Tulsa</strong> Public Works, 2030 Goal Kimley-Horn<br />
and Associates, Inc. from the INCOG Travel Demand Model<br />
Table 4: net sales tax revenue (annually)<br />
Net Sales<br />
Tax revenue<br />
Trends <strong>Tulsa</strong><br />
Continue 2030 Goal Change<br />
$16.6<br />
million<br />
Source: Kimley-Horn and Associates, Inc.<br />
$37.8<br />
million<br />
+135%<br />
Table 5: Fuel Wasted Due to Congestion (annually)<br />
Wasted Fuel<br />
(in gallons)<br />
Source: Kimley-Horn and Associates, Inc.<br />
Table 6: City air Quality indicators<br />
Trends <strong>Tulsa</strong><br />
Continue 2030 Goal Change<br />
10,700,000 8,100,000 -24%<br />
Trends <strong>Tulsa</strong><br />
Continue 2030 Goal Change<br />
noX (tons) 9,837 8,691 -12%<br />
co2 (tons) 2,379,800 2,102,400 -12%<br />
voc (tons) 11,805 10,429 -12%<br />
Source: Kimley-Horn and Associates, Inc.<br />
Table 7: regional air Quality indicators<br />
Trends <strong>Tulsa</strong><br />
Continue 2030 Goal Change<br />
noX (tons) 18,347 15,390 -16%<br />
co2 (tons) 4,438,400 3,723,000 -16%<br />
voc (tons) 22,016 18,468 -16%<br />
Source: Kimley-Horn and Associates, Inc.<br />
July 2010<br />
TR<br />
transportation – <strong>Tulsa</strong> comprehensive plan 7