Tulsa Comprehensive Plan - PLANiTULSA
Tulsa Comprehensive Plan - PLANiTULSA
Tulsa Comprehensive Plan - PLANiTULSA

Create successful ePaper yourself
Turn your PDF publications into a flip-book with our unique Google optimized e-Paper software.
Economic development<br />
parT i: AnAlySiS & FindinGS<br />
employment in <strong>Tulsa</strong><br />
<strong>Tulsa</strong>’s economy tends to rise and fall with the<br />
rest of the country. In the last 20 years, <strong>Tulsa</strong> slid<br />
into national recessions in 1980, 1981-2, 1990-1,<br />
2001, and 2009. Each recession has brought rising<br />
unemployment and lagging sales tax revenue, often<br />
interrupting City of <strong>Tulsa</strong> operations as well as<br />
scheduled capital investments.<br />
At times, economic recessions have been<br />
prolonged by local factors. For instance, the “oil<br />
bust” of 1982-4 followed on the heels of the 1981<br />
national economic recession. And in 2001, the<br />
energy, aviation, and telecommunications sectors<br />
were hit particularly hard, leading to slow job<br />
recovery locally.<br />
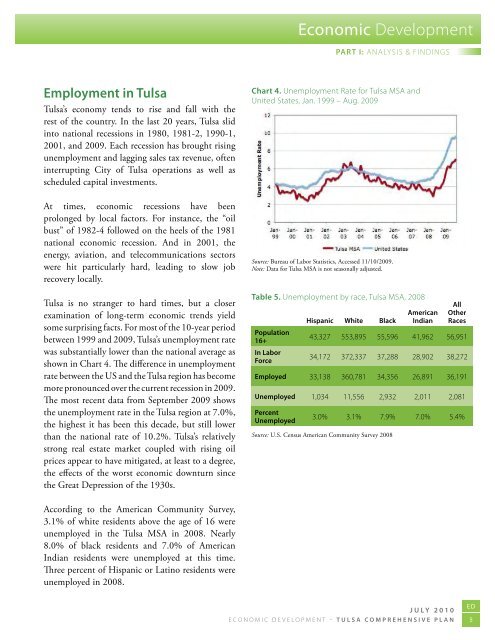
<strong>Tulsa</strong> is no stranger to hard times, but a closer<br />
examination of long-term economic trends yield<br />
some surprising facts. For most of the 10-year period<br />
between 1999 and 2009, <strong>Tulsa</strong>’s unemployment rate<br />
was substantially lower than the national average as<br />
shown in Chart 4. The difference in unemployment<br />
rate between the US and the <strong>Tulsa</strong> region has become<br />
more pronounced over the current recession in 2009.<br />
The most recent data from September 2009 shows<br />
the unemployment rate in the <strong>Tulsa</strong> region at 7.0%,<br />
the highest it has been this decade, but still lower<br />
than the national rate of 10.2%. <strong>Tulsa</strong>’s relatively<br />
strong real estate market coupled with rising oil<br />
prices appear to have mitigated, at least to a degree,<br />
the effects of the worst economic downturn since<br />
the Great Depression of the 1930s.<br />
chart 4. Unemployment Rate for tulsa mSA and<br />
United States, Jan. 1999 – Aug. 2009<br />
Source: Bureau of Labor Statistics, Accessed 11/10/2009.<br />
Note: Data for <strong>Tulsa</strong> MSA is not seasonally adjusted.<br />
Table 5. Unemployment by race, tulsa mSA, 2008<br />
all<br />
american other<br />
hispanic White Black indian races<br />
population<br />
16+<br />
in labor<br />
Force<br />
43,327 553,895 55,596 41,962 56,951<br />
34,172 372,337 37,288 28,902 38,272<br />
employed 33,138 360,781 34,356 26,891 36,191<br />
unemployed 1,034 11,556 2,932 2,011 2,081<br />
percent<br />
unemployed<br />
3.0% 3.1% 7.9% 7.0% 5.4%<br />
Source: U.S. Census American Community Survey 2008<br />
According to the American Community Survey,<br />
3.1% of white residents above the age of 16 were<br />
unemployed in the <strong>Tulsa</strong> MSA in 2008. Nearly<br />
8.0% of black residents and 7.0% of American<br />
Indian residents were unemployed at this time.<br />
Three percent of Hispanic or Latino residents were<br />
unemployed in 2008.<br />
July 2010<br />
ED<br />
economic development – <strong>Tulsa</strong> comprehensive plan 5