Annual Meeting Proceedings Part 1 - American Society of Clinical ...
Annual Meeting Proceedings Part 1 - American Society of Clinical ...
Annual Meeting Proceedings Part 1 - American Society of Clinical ...

Create successful ePaper yourself
Turn your PDF publications into a flip-book with our unique Google optimized e-Paper software.
598s Patient and Survivor Care<br />
9126 General Poster Session (Board #48H), Sat, 8:00 AM-12:00 PM<br />
Using scenarios to explain survival time: Attitudes <strong>of</strong> people with a cancer<br />
experience. Presenting Author: Martin R. Stockler, NHMRC <strong>Clinical</strong> Trials<br />
Centre, University <strong>of</strong> Sydney, Sydney, Australia<br />
Background: Most people with advanced cancer want some information on<br />
their life expectancy. We sought the attitudes <strong>of</strong> people with a cancer<br />
experience to using three scenarios for survival (best-case, worst-case, and<br />
typical) to explain life expectancy to people with advanced cancer.<br />
Methods: Oncology clinic attendees and Breast Cancer Network Australia<br />
(BCNA) members completed a survey describing two formats for explaining<br />
life expectancy to a hypothetical patient with incurable cancer - providing<br />
either three scenarios for survival or just the median survival time.<br />
Associations between respondent attitudes and their demographic and<br />
tumour characteristics were explored. Results: Characteristics <strong>of</strong> the505<br />
respondents from outpatient clinics (n�251) and BCNA (n�254) were:<br />
median age 58 years; female 74%; completed high school education 80%;<br />
breast primary 64%; self-report <strong>of</strong> cancer spread to other body parts 23%<br />
and; a median <strong>of</strong> 4 years since diagnosis <strong>of</strong> cancer. More respondents<br />
agreed that explaining three scenarios (vs. just the median survival time)<br />
would: make sense (93% vs. 75%), be helpful (93% vs. 69%), convey hope<br />
(68% vs. 44%), reassure (60% vs. 40%) and help family members (91%<br />
vs. 71%); all p-values �0.001. Fewer respondents agreed that explaining<br />
three scenarios (vs. median survival) would upset people (24% v 36%);<br />
p�0.001. The proportions <strong>of</strong> respondents agreeing that each <strong>of</strong> the 3<br />
scenarios should be presented were: best-case 89%, worst-case 82%, and<br />
typical 92%. Most respondents (85%) agreed it would be helpful to receive<br />
a printed summary <strong>of</strong> the scenarios for survival. For information about their<br />
own prognosis, 88% preferred all three scenarios and 5% a single estimate<br />
<strong>of</strong> the median. Respondents with higher education were more likely to agree<br />
that presenting three scenarios would be helpful (95% v 90%, p�0.05).<br />
Respondents with breast cancer were more likely to agree that explaining<br />
three scenarios would upset people (31% v 13%, p�0.001). Conclusions:<br />
Most respondents judged presentation <strong>of</strong> best-case, worst-case and typical<br />
scenarios preferable and more helpful and reassuring than presentation <strong>of</strong><br />
just the median survival time when explaining life expectancy to patients<br />
with advanced cancer.<br />
9128 General Poster Session (Board #49B), Sat, 8:00 AM-12:00 PM<br />
Caring for people at the end <strong>of</strong> life: How do cancer caregivers differ from<br />
other caregivers? Presenting Author: Afaf Girgis, University <strong>of</strong> New South<br />
Wales, Sydney, Australia<br />
Background: The size <strong>of</strong> the population in receipt <strong>of</strong> cancer care is growing<br />
as the population ages and grows, with many receiving outpatient care,<br />
living for longer and wishing to be cared for at home. Hence, cancer is now<br />
one <strong>of</strong> the most common health conditions in receipt <strong>of</strong> informal care<br />
giving. Methods: The South Australian Health Omnibus is an annual,<br />
face-to-face, cross-sectional, whole-<strong>of</strong>-population, multi-stage, systematic<br />
area sampling survey which seeks a minimum <strong>of</strong> 3,000 respondents each<br />
year state-wide. From 2000-2007, questions about end <strong>of</strong> life were asked.<br />
This study compares people who cared for someone with cancer until death<br />
(cancer caregivers) with caregivers <strong>of</strong> people with other life limiting<br />
illnesses (non-cancer caregivers). Results: 4,665/14,624 (31.9%; participation<br />
rate 71.6%) had someone close to them die from an “expected”<br />
death in the 5 years prior to being surveyed. One in 10 (10%; 1,504/<br />
14,624) provided hands-on (day-to-day or intermittent) care; the majority<br />
(79.5%) having cared for someone with cancer. Compared to non-cancer<br />
caregivers, cancer caregivers cared for someone who was significantly<br />
younger (mean age 66 vs 74 years; p�0.0001), and to have had a palliative<br />
care service involved in the care <strong>of</strong> that person (64.9% vs 39%; p�0.000).<br />
Whilst not statistically significant, cancer caregivers were somewhat less<br />
likely to be the spouse <strong>of</strong> the person they cared for (11.8% vs 16.8%); more<br />
likely to be <strong>of</strong> non-English speaking background (11% vs 7.5%); more<br />
likely to report that the deceased was comfortable in the last 2 weeks <strong>of</strong> life<br />
(44.1% vs 31.7%); and prepared to care again for someone with a<br />
life-limiting illness (81.3% vs 71.4%). Conclusions: Caring for someone<br />
with cancer at the end <strong>of</strong> life appears to be fundamentally different to other<br />
caregiver populations, particularly in relation to age <strong>of</strong>, and relationship to,<br />
the patient, which may contribute to their substantially greater utilisation<br />
<strong>of</strong> palliative care services. Being a younger caregiver increases the<br />
likelihood <strong>of</strong> them caring again in the future.<br />
9127 General Poster Session (Board #49A), Sat, 8:00 AM-12:00 PM<br />
A prospective study <strong>of</strong> family conferences (FCs) in a palliative care unit<br />
(PCU) at a comprehensive cancer center. Presenting Author: Rony Dev,<br />
University <strong>of</strong> Texas M. D. Anderson Cancer Center, Houston, TX<br />
Background: TheFC provides the family information and emotional support<br />
in the transition to end-<strong>of</strong>-life care. There are a few, mainly qualitative,<br />
studies <strong>of</strong> FCs in a palliative care setting. A retrospective report suggested<br />
increased emotional expression by family members when patients were not<br />
present in the FC. The purpose <strong>of</strong> our study was to determine the<br />
characteristics <strong>of</strong> FCs and the effect <strong>of</strong> patient participation on emotional<br />
expression by family members. Methods: A prospective study was conducted<br />
during 18-month period with140 consecutive FCs conducted by an<br />
interdisciplinary team (palliative care physician, social worker, and others).<br />
Data collected included demographics, discharge disposition, number <strong>of</strong><br />
participants, caregiver characteristics, expressions <strong>of</strong> emotional distress,<br />
conflict with healthcare providers, and topics discussed. Descriptive<br />
statistics and frequencies were calculated. Analysis was performed using a<br />
chi-square test. Results: 70 patients (50%) were female, 64 (46%) white,<br />
127 (91%) with solid tumors and a median age <strong>of</strong> 59. In 68/140 family<br />
meetings (49%), patients actively participated. The primary caregivers<br />
were predominantly female (66%), white (49%), and either the spouse or<br />
partner (59%). A median number <strong>of</strong> 4 family members and 4 healthcare<br />
providers attended the FCs with median duration <strong>of</strong> 1 hour and median <strong>of</strong> 2<br />
days prior to discharge. Questions concerning advanced directives, symptoms<br />
anticipated at death and caregiver well-being were infrequent.<br />
Patients verbalized distress frequently, (73.1%). Primary caregivers emotional<br />
expression <strong>of</strong> verbal distress were high but not significantly affected<br />
by patient presence (82% vs 82%, P:NS); however, verbal expressions <strong>of</strong><br />
emotional distress by family were more common when patients were absent<br />
(87%) than when present (73%), p � 0.037. Conclusions: There was a high<br />
frequency <strong>of</strong> expression <strong>of</strong> emotional distress by patients and family<br />
members. Patient participation was associated with decreased verbal<br />
emotional expression by family members but not the primary caregiver.<br />
Further studies are needed on the benefits <strong>of</strong> allocating additional time to<br />
meet with family members without patient presence during a FC.<br />
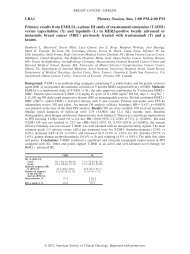
9129 General Poster Session (Board #49C), Sat, 8:00 AM-12:00 PM<br />
Polymorphisms in genes OPRM1, �-arrestin 2, STAT6, and COMT and<br />
clinical outcome to opioid therapy. Presenting Author: Sara Cros, Catalan<br />
Institute <strong>of</strong> Oncology, Hospital Germans Trias i Pujol, Barcelona, Spain<br />
Background: Morphine sulfate is the most widely used opioid in oncologic<br />
pain. There is a high variability in response between individuals. The<br />
objectives are to correlate the variability in response (R) and tolerability<br />
with polymorphisms within OPRM1, �-arrestin 2, STAT6 and COMT gene<br />
sequences. Methods: DNA from 44 oncologic patients (pts) with an EVA<br />
score � 6 was prospectively analyzed using allelic discrimination techniques<br />
and automatic sequencing. Pts (never treated with opioids) received<br />
morphine sulfate 10 mg per day. Pain was assessed by EVA score and<br />
toxicity was evaluated according to the most common opioid side effects.<br />
Symptomatology was reassessed after 72 hours. Chi-squared and Fisher’s<br />
tests where used to analyze data. Results: 17 pts (38.6%) responded with<br />
an EVA � 3. 6 pts (13.6%) did not experience toxicity, 36 pts (81.8%) had<br />
mild side effects and 2 pts (4.5%) had severe side effects. There was no<br />
relation between R rate (RR) and tolerance. 76.5% <strong>of</strong> pts responding to<br />
treatment had a CC/CT �-arrestin 2 genotype and this was associated with a<br />
better RR (CC/CT R � 46.4% vs. TT R � 25% p � 0.16). The 2 pts having<br />
severe side effects belonged to CC/CT group. COMT genotypes AA/GA were<br />
associated with a higher RR (83.3%pts) and better tolerance (100% pts<br />
with no toxicities). OPRM1 genotype GG was associated with both treatment<br />
failure (0% responded) and worse tolerance (any toxicity � 100%;<br />
severe side effects � 33%). Only 2,4% pts in the AA/GA genotype<br />
experienced some toxicity (p � 0.041). Although STAT6 genotypes were<br />
not associated with RR, tolerance was better in those pts with an AA or GA<br />
genotype with 97.5% pts showing either mild or no side effects (p �<br />
0.007). Conclusions: Common variants in �-arrestin 2, COMT, OPRM1 and<br />
STAT6 genes have shown to predict for opioid-associated response and side<br />
effects in oncologic patients. Further studies are needed to assess factors<br />
determining the variability in response and tolerance to opioid treatment.<br />
Visit abstract.asco.org and search by abstract for the full list <strong>of</strong> abstract authors and their disclosure information.