Annual Meeting Proceedings Part 1 - American Society of Clinical ...
Annual Meeting Proceedings Part 1 - American Society of Clinical ...
Annual Meeting Proceedings Part 1 - American Society of Clinical ...

Create successful ePaper yourself
Turn your PDF publications into a flip-book with our unique Google optimized e-Paper software.
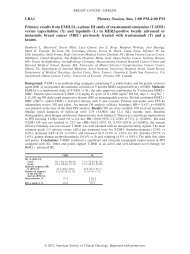
10012 Poster Discussion Session (Board #4), Sat, 1:15 PM-5:15 PM and<br />
4:45 PM-5:45 PM<br />
18f-FDG-PET imaging as an early survival predictor in patients with<br />
high-grade s<strong>of</strong>t tissue sarcomas undergoing neoadjuvant therapy. Presenting<br />
Author: Ken Herrmann, UCLA, Los Angeles, CA<br />
Background: Neoadjuvant therapy is associated with considerable toxicity<br />
and limited survival benefits in patients with s<strong>of</strong>t tissue sarcoma (STS). We<br />
prospectively evaluated whether 18F-FDG PET/CT (PET) imaging after the<br />
initial cycle and after end <strong>of</strong> neoadjuvant therapy could predict overall<br />
survival in these patients. Methods: 76 patients (primary STS: n�57;<br />
metastatic disease: n�19) with high grade STS were included in this study.<br />
PET was performed prior to (n�76), after one cycle (n�52) and after the<br />
end <strong>of</strong> neoadjuvant therapy (n�74). Overall survival was correlated with<br />
changes <strong>of</strong> SUVpeak, RECIST, histopathological response and other<br />
parameters predictive <strong>of</strong> STS survival. Results: One-, two- and five- year<br />
survival rates were 95�3.0%, 86�4.6% and 68�6.6% for primary STS.<br />
Corresponding one- and two- year survival rates for recurrent/metastatic<br />
STS were 77�10.0% and 47�12.1%. Optimal cut-<strong>of</strong>f for early decreases<br />
in SUV peak were significant predictors <strong>of</strong> survival in log-rank test<br />
(p�0.027 and p�0.043). However, late decreases in SUV peak were only<br />
predictive in primary STS (SUV peak decrease 57%; p�0.035) but not in<br />
recurrent/metastatic STS (SUV peak decrease 52%; p�0.057). In primary<br />
STS, 7/15 early PET non-responders but only 4/24 early PET responders<br />
died during follow up (p�0.068). Conclusions: 18F-FDG-PET seems feasible<br />
to predict survival after the initial cycle <strong>of</strong> neoadjuvant chemotherapy<br />
in both patients with primary STS and recurrent/metastatic STS and can<br />
potentially serve as an intermediate endpoint biomarker in clinical research<br />
and patient care.<br />
10014 Poster Discussion Session (Board #6), Sat, 1:15 PM-5:15 PM and<br />
4:45 PM-5:45 PM<br />
Growth modulation index and RECIST-based STBSG-EORTC criteria for the<br />
assessment <strong>of</strong> drug activity in advanced s<strong>of</strong>t tissue sarcoma (ASTS)<br />
patients (pts). Presenting Author: Sophie Cousin, Centre Oscar Lambret,<br />
Lille, France<br />
Background: Despite promising phase II trial results, most <strong>of</strong> new drugs<br />
failed to improve the overall survival (OS) in ASTS pts. The choice <strong>of</strong> the<br />
endpoint in early trials remains crucial. We have evaluated the Growth<br />
Modulation Index (GMI) as potential endpoint. The GMI is defined as the<br />
Time To Progression with the second (or n�1) line <strong>of</strong> chemotherapy (TTP2)<br />
divided by the TTP with the first (or n) line (TTP1). Methods: We have<br />
carried out a retrospective multicenter study in pts receiving second-line<br />
chemotherapy after failure/intolerance to doxorubicin-based regimens.<br />
Data collected included best response(s), TTP1 & TTP2 and OS. Treatments<br />
have been classified as �active� treatment according to the EORTC-<br />
STBSG criteria (3-month Progression-free rate �40% or 6-month<br />
PFR�14%: including trabectedin, ifosfamide, gemcitabine�docetaxel for<br />
all subtypes and weekly paclitaxel for angiosarcoma) versus non-active<br />
drugs. Comparisons used chi-2 tests and Log-rank tests. We performed a<br />
logistic regression analysis for identifying factors associated with longer<br />
GMI. Results: The study population consisted in 106 men and 121 women,<br />
the median age was 57 years. 110 pts (48.4%) have received �active<br />
drugs�. The median TTP1, TTP2 and GMI were 197 days, 134 days and<br />
0.75, respectively. The median OS was 446 days. 70 pts experienced<br />
GMI�1.33 (30.6%). There was a strong relation between best objective<br />
response and GMI (p�0.0001). The treatment with �active drug� was not<br />
associated with an improvement <strong>of</strong> the OS: 490 days 407 versus days<br />
(p�0.524). The median OS <strong>of</strong> pts with GMI�1, GMI�[1.00-1.33] and<br />
GMI�1.33 were 324, 302 and 710 days, respectively (p�0.0001). None<br />
<strong>of</strong> the following factors were associated with GMI�1.33 in logistic<br />
regression analysis: age, gender, histological subtypes, grade, metastasis<br />
locations, interval between diagnosis & metastasis, association with ifosfamide<br />
or dacarbazine in 1st-line regimen or treatment with �active drug� in<br />
second-line. Conclusions: GMI seems to be an interesting endpoint providing<br />
additional information compared to classical criteria. GMI�1.33 is<br />
associated with significant improvement <strong>of</strong> the OS.<br />
Sarcoma<br />
633s<br />
10013 Poster Discussion Session (Board #5), Sat, 1:15 PM-5:15 PM and<br />
4:45 PM-5:45 PM<br />
Growth modulation index (GMI) as a metric <strong>of</strong> clinical benefit assessment<br />
among advanced s<strong>of</strong>t tissue sarcoma (ASTS) patients receiving trabectedin<br />
as salvage therapy. Presenting Author: Nicolas Penel, Centre Oscar<br />
Lambret, Lille, France<br />
Background: Von H<strong>of</strong>f has proposed GMI �1.33 in cancer clinical trials as a<br />
sign <strong>of</strong> drug activity. GMI is the ratio between time to progression (TTP)<br />
with the nth line (TTPn) <strong>of</strong> therapy divided by the TTPn-1 with the n-1th line<br />
<strong>of</strong> therapy. With this endpoint, each patient is his/her own control. Methods:<br />
We have carried out a retrospective analysis <strong>of</strong> 279 pretreated ASTS<br />
patients treated in four consecutive phase II trials with trabectedin 1.5<br />
mg/m², given as a 24-hour infusion every 3 weeks. Results: The study<br />
population consisted <strong>of</strong> 170 women and 109 men with a median age <strong>of</strong> 52.<br />
The two most common histologies were leiomyosarcoma (145 patients,<br />
52%) and liposarcoma (59, 21%). 142 (51%) patients received one prior<br />
line and 137 (49%) �2 lines. The median TTPn was 2.8 months (range:<br />
0.2-26.8), whereas the median TTPn-1 was 4.0 months (range: 0.3-79.5).<br />
The Spearman correlation coefficient between TTPn-1 and TTPn was 0.07<br />
(p�0.23). The median GMI was 0.6 (range: 0.0-14.4). 177 patients<br />
(63%) had a GMI �1, 21 (8%) a GMI � 1-1.33 and 81 (29%) a GMI<br />
�1.33. The median overall survival (OS) strongly correlated with GMI<br />
groups: OS was 9.1, 13.9 and 23.8 months, respectively (p�0.0005,<br />
log-rank test). There were also a strong correlations between response rate<br />
and GMI (p�0.0001, Fisher exact test), and between GMI and progressionfree<br />
survival (�0.0001, log-rank test). The logistic regression analysis<br />
retained only performance status (PS) [OR�1.76 if PS�0; p�0.04]<br />
associated with GMI�1.33. Sarcoma grade (p�0.21), histological subtype<br />
(p�0.16), and number <strong>of</strong> prior chemotherapy lines (p�0.95) were not<br />
associated with GMI�1.33. Conclusions: Overall,�30% <strong>of</strong> patients experienced<br />
GMI�1.33 regardless <strong>of</strong> histological subtype or grade, and number<br />
<strong>of</strong> prior lines <strong>of</strong> chemotherapy. Patients with PS�0 benefit more from<br />
trabectedin. GMI�1.33 is associated with longer OS (median �24<br />
months). GMI is better defined than previously described parameter such<br />
as �Tumor Growth Rate� (Lopez-Martin, Abstract 3293, ASCO 2003). GMI<br />
as an indicator <strong>of</strong> drug activity merits further exploration in this setting.<br />
10015 Poster Discussion Session (Board #7), Sat, 1:15 PM-5:15 PM and<br />
4:45 PM-5:45 PM<br />
A prognostic nomogram for prediction <strong>of</strong> recurrence following surgical resection<br />
<strong>of</strong> desmoid tumors. Presenting Author: Aimee Marie Crago, Department <strong>of</strong><br />
Surgery, Memorial Sloan-Kettering Cancer Center, New York, NY<br />
Background: Desmoid tumors can respond to novel chemotherapeutics (e.g.,<br />
sorafenib). We sought to construct a postoperative nomogram identifying<br />
desmoid patients who are at high-risk for local recurrence and potential<br />
candidates for systemic therapy. Methods: Desmoid patients undergoing resection<br />
from 1982-2011 were identified from a single-institution prospective<br />
database. Cox regression analysis was used to create a desmoid-specific<br />
recurrence nomogram integrating clinical risk factors. Results: Desmoids were<br />
treated surgically in 495 patients (median follow-up 60 months). Of 439<br />
patients undergoing complete gross resection, 100 recurred (92 within 5 years<br />
<strong>of</strong> operation). Five-year recurrence-free survival (RFS) was 71%. Only 8 patients<br />
died <strong>of</strong> disease, all after R2 resection (6 with intraabdominal desmoids).<br />
Radiation was associated with worse RFS (p�0.001). Multivariate analysis<br />
suggested associations between recurrence and extremity location, young age,<br />
and large tumors, but not margin (Table). Abdominal wall tumors had the best<br />
outcome (5-year RFS 92% vs. 34% in patients �25y.o. with large, extremity<br />
tumors). Age, site and size were used to construct an internally-validated<br />
nomogram (concordance index 0.703). Integration <strong>of</strong> margin, gender, depth,<br />
and presentation status (primary vs. recurrent disease) did not improve concordance<br />
significantly (0.707). Conclusions: A postoperative nomogram including<br />
only size, site and age predicts local recurrence and aids in counseling patients.<br />
Systemic therapies may be tested in young patients with large, extremity<br />
desmoids, but surgery alone is curative for most abdominal wall lesions.<br />
Multivariate analysis<br />
factor Hazard ratio (95% C.I.) P value<br />
Margin status (R1 vs. R0) 0.99 (0.65, 1.52) 0.97<br />
Presentation (recurrent vs. primary) 1.16 (0.70, 1.90) 0.57<br />
Depth (deep vs. superficial) 1.37 (0.54, 3.45) 0.51<br />
Gender (female vs. male) 1.32 (0.82, 2.10) 0.25<br />
Site (vs. abdominal wall)<br />
Extremity 5.02 (2.14, 8.42) �0.001<br />
Chest wall 3.12 (1.20, 8.42) 0.020<br />
Intraabdominal 2.73 (0.98, 7.59) 0.054<br />
Other 1.54 (0.31, 7.63) 0.60<br />
Size (>10 cm vs. 65y.o.)<br />