

Air quality expert group - Fine particulate matter (PM2.5) in ... - Defra
Air quality expert group - Fine particulate matter (PM2.5) in ... - Defra
Air quality expert group - Fine particulate matter (PM2.5) in ... - Defra

Create successful ePaper yourself
Turn your PDF publications into a flip-book with our unique Google optimized e-Paper software.
<strong>PM2.5</strong> emissions and receptor modell<strong>in</strong>g<br />
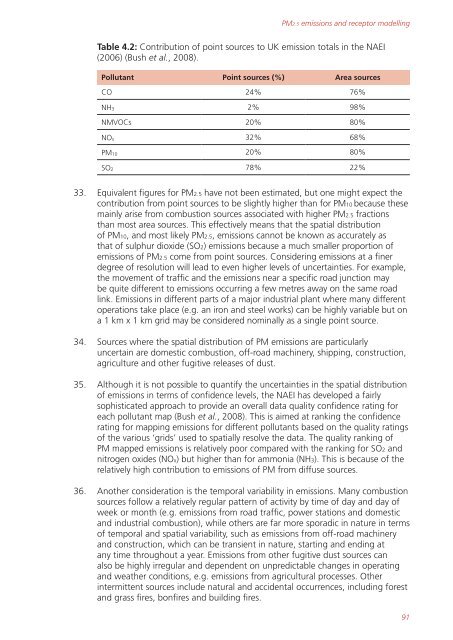
Table 4.2: Contribution of po<strong>in</strong>t sources to UK emission totals <strong>in</strong> the NAEI<br />
(2006) (Bush et al., 2008).<br />
Pollutant Po<strong>in</strong>t sources (%) Area sources<br />
CO 24% 76%<br />
NH3 2% 98%<br />
NMVOCs 20% 80%<br />
NOx 32% 68%<br />
PM10 20% 80%<br />
SO2 78% 22%<br />
33. Equivalent figures for <strong>PM2.5</strong> have not been estimated, but one might expect the<br />
contribution from po<strong>in</strong>t sources to be slightly higher than for PM10 because these<br />
ma<strong>in</strong>ly arise from combustion sources associated with higher <strong>PM2.5</strong> fractions<br />
than most area sources. This effectively means that the spatial distribution<br />
of PM10, and most likely <strong>PM2.5</strong>, emissions cannot be known as accurately as<br />
that of sulphur dioxide (SO2) emissions because a much smaller proportion of<br />
emissions of <strong>PM2.5</strong> come from po<strong>in</strong>t sources. Consider<strong>in</strong>g emissions at a f<strong>in</strong>er<br />
degree of resolution will lead to even higher levels of uncerta<strong>in</strong>ties. For example,<br />
the movement of traffic and the emissions near a specific road junction may<br />
be quite different to emissions occurr<strong>in</strong>g a few metres away on the same road<br />
l<strong>in</strong>k. Emissions <strong>in</strong> different parts of a major <strong>in</strong>dustrial plant where many different<br />
operations take place (e.g. an iron and steel works) can be highly variable but on<br />
a 1 km x 1 km grid may be considered nom<strong>in</strong>ally as a s<strong>in</strong>gle po<strong>in</strong>t source.<br />
34. Sources where the spatial distribution of PM emissions are particularly<br />
uncerta<strong>in</strong> are domestic combustion, off-road mach<strong>in</strong>ery, shipp<strong>in</strong>g, construction,<br />
agriculture and other fugitive releases of dust.<br />
35. Although it is not possible to quantify the uncerta<strong>in</strong>ties <strong>in</strong> the spatial distribution<br />
of emissions <strong>in</strong> terms of confidence levels, the NAEI has developed a fairly<br />
sophisticated approach to provide an overall data <strong>quality</strong> confidence rat<strong>in</strong>g for<br />
each pollutant map (Bush et al., 2008). This is aimed at rank<strong>in</strong>g the confidence<br />
rat<strong>in</strong>g for mapp<strong>in</strong>g emissions for different pollutants based on the <strong>quality</strong> rat<strong>in</strong>gs<br />
of the various ‘grids’ used to spatially resolve the data. The <strong>quality</strong> rank<strong>in</strong>g of<br />
PM mapped emissions is relatively poor compared with the rank<strong>in</strong>g for SO2 and<br />
nitrogen oxides (NOx) but higher than for ammonia (NH3). This is because of the<br />
relatively high contribution to emissions of PM from diffuse sources.<br />
36. Another consideration is the temporal variability <strong>in</strong> emissions. Many combustion<br />
sources follow a relatively regular pattern of activity by time of day and day of<br />
week or month (e.g. emissions from road traffic, power stations and domestic<br />
and <strong>in</strong>dustrial combustion), while others are far more sporadic <strong>in</strong> nature <strong>in</strong> terms<br />
of temporal and spatial variability, such as emissions from off-road mach<strong>in</strong>ery<br />
and construction, which can be transient <strong>in</strong> nature, start<strong>in</strong>g and end<strong>in</strong>g at<br />
any time throughout a year. Emissions from other fugitive dust sources can<br />
also be highly irregular and dependent on unpredictable changes <strong>in</strong> operat<strong>in</strong>g<br />
and weather conditions, e.g. emissions from agricultural processes. Other<br />
<strong>in</strong>termittent sources <strong>in</strong>clude natural and accidental occurrences, <strong>in</strong>clud<strong>in</strong>g forest<br />
and grass fires, bonfires and build<strong>in</strong>g fires.<br />
91


