

Air quality expert group - Fine particulate matter (PM2.5) in ... - Defra
Air quality expert group - Fine particulate matter (PM2.5) in ... - Defra
Air quality expert group - Fine particulate matter (PM2.5) in ... - Defra

Create successful ePaper yourself
Turn your PDF publications into a flip-book with our unique Google optimized e-Paper software.
<strong>PM2.5</strong> <strong>in</strong> the UK<br />
110<br />
is predicated on the assumption that emissions of elemental carbon from<br />
combustion sources are always accompanied by a constant proportion of<br />
organic carbon, and that the ratio of OC to EC <strong>in</strong> those primary emissions<br />
is equal to the m<strong>in</strong>imum ratio observed <strong>in</strong> atmospheric measurements. An<br />
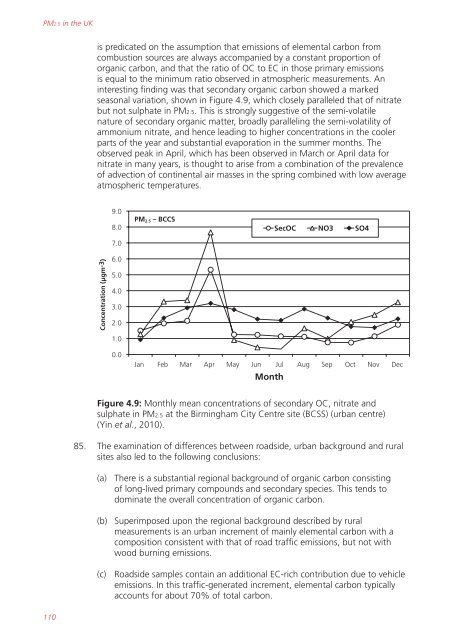
<strong>in</strong>terest<strong>in</strong>g f<strong>in</strong>d<strong>in</strong>g was that secondary organic carbon showed a marked<br />
seasonal variation, shown <strong>in</strong> Figure 4.9, which closely paralleled that of nitrate<br />
but not sulphate <strong>in</strong> <strong>PM2.5</strong>. This is strongly suggestive of the semi-volatile<br />
nature of secondary organic <strong>matter</strong>, broadly parallel<strong>in</strong>g the semi-volatility of<br />
ammonium nitrate, and hence lead<strong>in</strong>g to higher concentrations <strong>in</strong> the cooler<br />
parts of the year and substantial evaporation <strong>in</strong> the summer months. The<br />
observed peak <strong>in</strong> April, which has been observed <strong>in</strong> March or April data for<br />
nitrate <strong>in</strong> many years, is thought to arise from a comb<strong>in</strong>ation of the prevalence<br />
of advection of cont<strong>in</strong>ental air masses <strong>in</strong> the spr<strong>in</strong>g comb<strong>in</strong>ed with low average<br />
atmospheric temperatures.<br />
Concentration (µgm-3)<br />
9.0<br />
8.0<br />
7.0<br />
6.0<br />
5.0<br />
4.0<br />
3.0<br />
2.0<br />
1.0<br />
0.0<br />
<strong>PM2.5</strong> – BCCS<br />
Jan Feb Mar Apr May Jun Jul Aug Sep Oct Nov Dec<br />
Month<br />
SecOC NO3 SO4<br />
Figure 4.9: Monthly mean concentrations of secondary OC, nitrate and<br />
sulphate <strong>in</strong> <strong>PM2.5</strong> at the Birm<strong>in</strong>gham City Centre site (BCSS) (urban centre)<br />
(Y<strong>in</strong> et al., 2010).<br />
85. The exam<strong>in</strong>ation of differences between roadside, urban background and rural<br />
sites also led to the follow<strong>in</strong>g conclusions:<br />
(a) There is a substantial regional background of organic carbon consist<strong>in</strong>g<br />
of long-lived primary compounds and secondary species. This tends to<br />
dom<strong>in</strong>ate the overall concentration of organic carbon.<br />
(b) Superimposed upon the regional background described by rural<br />
measurements is an urban <strong>in</strong>crement of ma<strong>in</strong>ly elemental carbon with a<br />
composition consistent with that of road traffic emissions, but not with<br />
wood burn<strong>in</strong>g emissions.<br />
(c) Roadside samples conta<strong>in</strong> an additional EC-rich contribution due to vehicle<br />
emissions. In this traffic-generated <strong>in</strong>crement, elemental carbon typically<br />
accounts for about 70% of total carbon.


