

Air quality expert group - Fine particulate matter (PM2.5) in ... - Defra
Air quality expert group - Fine particulate matter (PM2.5) in ... - Defra
Air quality expert group - Fine particulate matter (PM2.5) in ... - Defra

Create successful ePaper yourself
Turn your PDF publications into a flip-book with our unique Google optimized e-Paper software.
<strong>PM2.5</strong> <strong>in</strong> the UK<br />
50<br />
3.2.4 Seasonal variations <strong>in</strong> <strong>PM2.5</strong> at urban background sites<br />
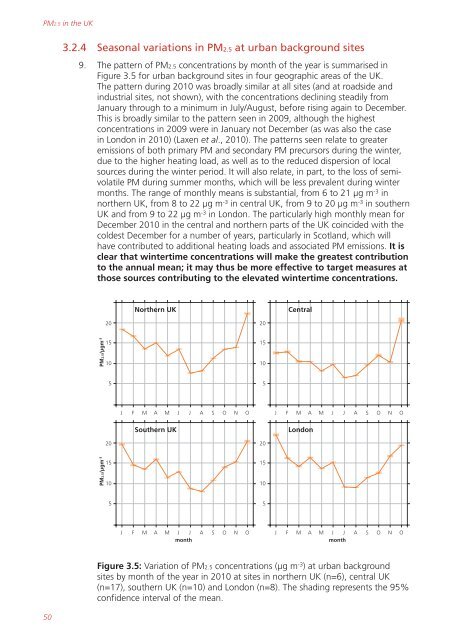
9. The pattern of <strong>PM2.5</strong> concentrations by month of the year is summarised <strong>in</strong><br />
Figure 3.5 for urban background sites <strong>in</strong> four geographic areas of the UK.<br />
The pattern dur<strong>in</strong>g 2010 was broadly similar at all sites (and at roadside and<br />
<strong>in</strong>dustrial sites, not shown), with the concentrations decl<strong>in</strong><strong>in</strong>g steadily from<br />
January through to a m<strong>in</strong>imum <strong>in</strong> July/August, before ris<strong>in</strong>g aga<strong>in</strong> to December.<br />
This is broadly similar to the pattern seen <strong>in</strong> 2009, although the highest<br />
concentrations <strong>in</strong> 2009 were <strong>in</strong> January not December (as was also the case<br />
<strong>in</strong> London <strong>in</strong> 2010) (Laxen et al., 2010). The patterns seen relate to greater<br />
emissions of both primary PM and secondary PM precursors dur<strong>in</strong>g the w<strong>in</strong>ter,<br />
due to the higher heat<strong>in</strong>g load, as well as to the reduced dispersion of local<br />
sources dur<strong>in</strong>g the w<strong>in</strong>ter period. It will also relate, <strong>in</strong> part, to the loss of semivolatile<br />
PM dur<strong>in</strong>g summer months, which will be less prevalent dur<strong>in</strong>g w<strong>in</strong>ter<br />
months. The range of monthly means is substantial, from 6 to 21 µg m -3 <strong>in</strong><br />
northern UK, from 8 to 22 µg m -3 <strong>in</strong> central UK, from 9 to 20 µg m -3 <strong>in</strong> southern<br />
UK and from 9 to 22 µg m -3 <strong>in</strong> London. The particularly high monthly mean for<br />
December 2010 <strong>in</strong> the central and northern parts of the UK co<strong>in</strong>cided with the<br />
coldest December for a number of years, particularly <strong>in</strong> Scotland, which will<br />
have contributed to additional heat<strong>in</strong>g loads and associated PM emissions. It is<br />
clear that w<strong>in</strong>tertime concentrations will make the greatest contribution<br />
to the annual mean; it may thus be more effective to target measures at<br />
those sources contribut<strong>in</strong>g to the elevated w<strong>in</strong>tertime concentrations.<br />
<strong>PM2.5</strong>/µgm -3<br />
<strong>PM2.5</strong>/µgm -3<br />
20<br />
15<br />
10<br />
5<br />
20<br />
15<br />
10<br />
5<br />
Northern UK<br />
J F M A M J J A S O N O<br />
Southern UK<br />
20<br />
15<br />
10<br />
5<br />
20<br />
15<br />
10<br />
Central<br />
J F M A M J J A S O N O<br />
London<br />
J F M A M J J A S O N O J F M A M J J A S O N O<br />
month month<br />
Figure 3.5: Variation of <strong>PM2.5</strong> concentrations (µg m -3 ) at urban background<br />
sites by month of the year <strong>in</strong> 2010 at sites <strong>in</strong> northern UK (n=6), central UK<br />
(n=17), southern UK (n=10) and London (n=8). The shad<strong>in</strong>g represents the 95%<br />
confidence <strong>in</strong>terval of the mean.<br />
5


