

Air quality expert group - Fine particulate matter (PM2.5) in ... - Defra
Air quality expert group - Fine particulate matter (PM2.5) in ... - Defra
Air quality expert group - Fine particulate matter (PM2.5) in ... - Defra

Create successful ePaper yourself
Turn your PDF publications into a flip-book with our unique Google optimized e-Paper software.
µgm -3<br />
µgm -3<br />
µgm -3<br />
µgm -3<br />
TIME SERIES OF DAILY AVERAGE OF <strong>PM2.5</strong> 2003 (HAR)<br />
100<br />
90<br />
80<br />
70<br />
60<br />
50<br />
40<br />
30<br />
20<br />
10<br />
Red – Observation Blue – Model<br />
0<br />
JAN<br />
2003<br />
FEB MAR APR MAY JUN JUL AUG SEP OCT NOV DEC<br />
100<br />
90<br />
80<br />
70<br />
60<br />
50<br />
40<br />
30<br />
20<br />
10<br />
0<br />
JAN<br />
2003<br />
100<br />
90<br />
80<br />
70<br />
60<br />
50<br />
40<br />
30<br />
20<br />
10<br />
0<br />
JAN<br />
2006<br />
100<br />
90<br />
80<br />
70<br />
60<br />
50<br />
40<br />
30<br />
20<br />
10<br />
0<br />
JAN<br />
2006<br />
TIME SERIES OF DAILY AVERAGE OF <strong>PM2.5</strong> 2003 (LBB)<br />
FEB MAR APR MAY JUN JUL AUG SEP OCT NOV DEC<br />
TIME SERIES OF DAILY AVERAGE OF <strong>PM2.5</strong> 2006 (HAR)<br />
FEB MAR APR MAY JUN JUL AUG SEP OCT NOV DEC<br />
TIME SERIES OF DAILY AVERAGE OF <strong>PM2.5</strong> 2006 (LNK)<br />
FEB MAR APR MAY JUN JUL AUG SEP OCT NOV DEC<br />
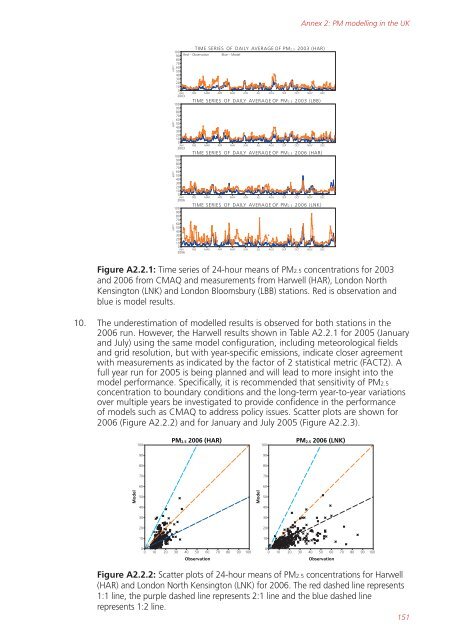
Figure A2.2.1: Time series of 24-hour means of <strong>PM2.5</strong> concentrations for 2003<br />
and 2006 from CMAQ and measurements from Harwell (HAR), London North<br />
Kens<strong>in</strong>gton (LNK) and London Bloomsbury (LBB) stations. Red is observation and<br />
blue is model results.<br />
10. The underestimation of modelled results is observed for both stations <strong>in</strong> the<br />
2006 run. However, the Harwell results shown <strong>in</strong> Table A2.2.1 for 2005 (January<br />
and July) us<strong>in</strong>g the same model configuration, <strong>in</strong>clud<strong>in</strong>g meteorological fields<br />
and grid resolution, but with year-specific emissions, <strong>in</strong>dicate closer agreement<br />
with measurements as <strong>in</strong>dicated by the factor of 2 statistical metric (FACT2). A<br />
full year run for 2005 is be<strong>in</strong>g planned and will lead to more <strong>in</strong>sight <strong>in</strong>to the<br />
model performance. Specifically, it is recommended that sensitivity of <strong>PM2.5</strong><br />
concentration to boundary conditions and the long-term year-to-year variations<br />
over multiple years be <strong>in</strong>vestigated to provide confidence <strong>in</strong> the performance<br />
of models such as CMAQ to address policy issues. Scatter plots are shown for<br />
2006 (Figure A2.2.2) and for January and July 2005 (Figure A2.2.3).<br />
Model<br />
100<br />
90<br />
80<br />
70<br />
60<br />
50<br />
40<br />
30<br />
20<br />
10<br />
<strong>PM2.5</strong> 2006 (HAR)<br />
0<br />
0 10 20 30 40 50 60 70 80 90 100<br />
Observation<br />
Model<br />
100<br />
90<br />
80<br />
70<br />
60<br />
50<br />
40<br />
30<br />
20<br />
10<br />
Annex 2: PM modell<strong>in</strong>g <strong>in</strong> the UK<br />
<strong>PM2.5</strong> 2006 (LNK)<br />
0<br />
0 10 20 30 40 50 60 70 80 90 100<br />
Observation<br />
Figure A2.2.2: Scatter plots of 24-hour means of <strong>PM2.5</strong> concentrations for Harwell<br />
(HAR) and London North Kens<strong>in</strong>gton (LNK) for 2006. The red dashed l<strong>in</strong>e represents<br />
1:1 l<strong>in</strong>e, the purple dashed l<strong>in</strong>e represents 2:1 l<strong>in</strong>e and the blue dashed l<strong>in</strong>e<br />
represents 1:2 l<strong>in</strong>e.<br />
151


