

Air quality expert group - Fine particulate matter (PM2.5) in ... - Defra
Air quality expert group - Fine particulate matter (PM2.5) in ... - Defra
Air quality expert group - Fine particulate matter (PM2.5) in ... - Defra

You also want an ePaper? Increase the reach of your titles
YUMPU automatically turns print PDFs into web optimized ePapers that Google loves.
<strong>PM2.5</strong> <strong>in</strong> the UK<br />
70<br />
43. The UK has <strong>in</strong>itiated a monitor<strong>in</strong>g programme to meet the Directive<br />
requirements <strong>in</strong> respect of PM composition. MARGA <strong>in</strong>struments were <strong>in</strong>stalled<br />
at Auchencorth Moss (located to the south of Ed<strong>in</strong>burgh) <strong>in</strong> 2006 and at<br />
Harwell (located to the south of Oxford) <strong>in</strong> 2009. These <strong>in</strong>struments specifically<br />
measure the species listed above <strong>in</strong> the <strong>PM2.5</strong> and PM10 fractions on an hourly<br />
basis (but not Fe). The data have been exam<strong>in</strong>ed carefully by AQEG, but<br />
concerns about their <strong>quality</strong> make them unsuitable for analysis. These concerns<br />
<strong>in</strong>clude concentrations be<strong>in</strong>g higher <strong>in</strong> the <strong>PM2.5</strong> fraction than the PM10 fraction<br />
and a lack of ionic balance. It is therefore recommended that the suitability<br />
of these <strong>in</strong>struments for meet<strong>in</strong>g report<strong>in</strong>g obligations under the<br />
Directive is reviewed.<br />
44. Monitor<strong>in</strong>g of total ambient nitrate, sulphate and ammonium concentrations<br />
has been undertaken over a number of years at sites across the UK (see Chapter<br />
2). Although these measurements are not specifically for the <strong>PM2.5</strong> size fraction,<br />
the results are still useful for an analysis of seasonal patterns and trends.<br />
3.9.3 Seasonal pattern of nitrate and sulphate<br />
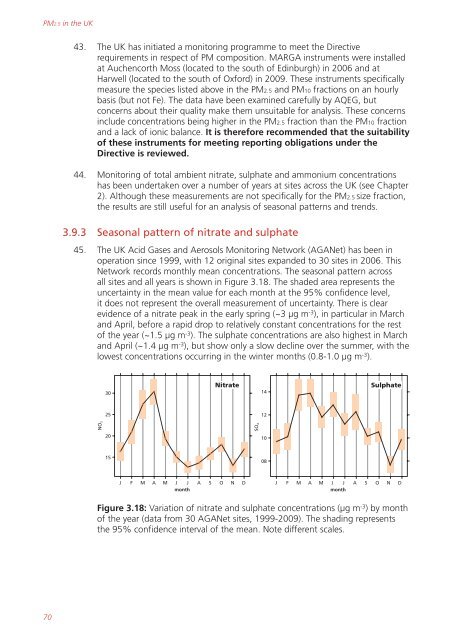
45. The UK Acid Gases and Aerosols Monitor<strong>in</strong>g Network (AGANet) has been <strong>in</strong><br />
operation s<strong>in</strong>ce 1999, with 12 orig<strong>in</strong>al sites expanded to 30 sites <strong>in</strong> 2006. This<br />
Network records monthly mean concentrations. The seasonal pattern across<br />
all sites and all years is shown <strong>in</strong> Figure 3.18. The shaded area represents the<br />
uncerta<strong>in</strong>ty <strong>in</strong> the mean value for each month at the 95% confidence level,<br />
it does not represent the overall measurement of uncerta<strong>in</strong>ty. There is clear<br />
evidence of a nitrate peak <strong>in</strong> the early spr<strong>in</strong>g (~3 µg m -3 ), <strong>in</strong> particular <strong>in</strong> March<br />
and April, before a rapid drop to relatively constant concentrations for the rest<br />
of the year (~1.5 µg m -3 ). The sulphate concentrations are also highest <strong>in</strong> March<br />
and April (~1.4 µg m -3 ), but show only a slow decl<strong>in</strong>e over the summer, with the<br />
lowest concentrations occurr<strong>in</strong>g <strong>in</strong> the w<strong>in</strong>ter months (0.8-1.0 µg m -3 ).<br />
NO 2<br />
30<br />
25<br />
20<br />
15<br />
Nitrate<br />
J F M A M J J A S O N D<br />
month<br />
SO 4<br />
14<br />
12<br />
10<br />
08<br />
Sulphate<br />
J F M A M J J A S O N D<br />
month<br />
Figure 3.18: Variation of nitrate and sulphate concentrations (µg m -3 ) by month<br />
of the year (data from 30 AGANet sites, 1999-2009). The shad<strong>in</strong>g represents<br />
the 95% confidence <strong>in</strong>terval of the mean. Note different scales.


