

Air quality expert group - Fine particulate matter (PM2.5) in ... - Defra
Air quality expert group - Fine particulate matter (PM2.5) in ... - Defra
Air quality expert group - Fine particulate matter (PM2.5) in ... - Defra

You also want an ePaper? Increase the reach of your titles
YUMPU automatically turns print PDFs into web optimized ePapers that Google loves.
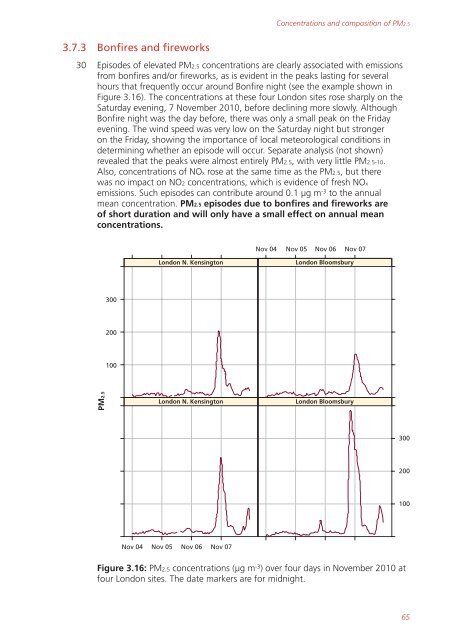
3.7.3 Bonfires and fireworks<br />
Concentrations and composition of <strong>PM2.5</strong><br />
30 Episodes of elevated <strong>PM2.5</strong> concentrations are clearly associated with emissions<br />
from bonfires and/or fireworks, as is evident <strong>in</strong> the peaks last<strong>in</strong>g for several<br />
hours that frequently occur around Bonfire night (see the example shown <strong>in</strong><br />
Figure 3.16). The concentrations at these four London sites rose sharply on the<br />
Saturday even<strong>in</strong>g, 7 November 2010, before decl<strong>in</strong><strong>in</strong>g more slowly. Although<br />
Bonfire night was the day before, there was only a small peak on the Friday<br />
even<strong>in</strong>g. The w<strong>in</strong>d speed was very low on the Saturday night but stronger<br />
on the Friday, show<strong>in</strong>g the importance of local meteorological conditions <strong>in</strong><br />
determ<strong>in</strong><strong>in</strong>g whether an episode will occur. Separate analysis (not shown)<br />
revealed that the peaks were almost entirely <strong>PM2.5</strong>, with very little <strong>PM2.5</strong>-10.<br />
Also, concentrations of NOx rose at the same time as the <strong>PM2.5</strong>, but there<br />
was no impact on NO2 concentrations, which is evidence of fresh NOx<br />
emissions. Such episodes can contribute around 0.1 µg m -3 to the annual<br />
mean concentration. <strong>PM2.5</strong> episodes due to bonfires and fireworks are<br />
of short duration and will only have a small effect on annual mean<br />
concentrations.<br />
<strong>PM2.5</strong><br />
300<br />
200<br />
100<br />
Nov 04<br />
Nov 05 Nov 06 Nov 07<br />
London N. Kens<strong>in</strong>gton London Bloomsbury<br />
London N. Kens<strong>in</strong>gton London Bloomsbury<br />
Nov 04 Nov 05 Nov 06 Nov 07<br />
Figure 3.16: <strong>PM2.5</strong> concentrations (µg m -3 ) over four days <strong>in</strong> November 2010 at<br />
four London sites. The date markers are for midnight.<br />
300<br />
200<br />
100<br />
65


