

Air quality expert group - Fine particulate matter (PM2.5) in ... - Defra
Air quality expert group - Fine particulate matter (PM2.5) in ... - Defra
Air quality expert group - Fine particulate matter (PM2.5) in ... - Defra

Create successful ePaper yourself
Turn your PDF publications into a flip-book with our unique Google optimized e-Paper software.
<strong>PM2.5</strong> <strong>in</strong> the UK<br />
160<br />
SIA components for future years. These projections were compared with PCM<br />
scenario predictions made us<strong>in</strong>g the ESCs from the EMEP model. It was found<br />
that the models gave broadly consistent results, with the NAME ESCs tend<strong>in</strong>g to<br />
<strong>in</strong>dicate a greater impact of change <strong>in</strong> emissions on concentrations than EMEP.<br />
Comparison of maps of the ESCs showed a greater spatial variation <strong>in</strong> NAME.<br />
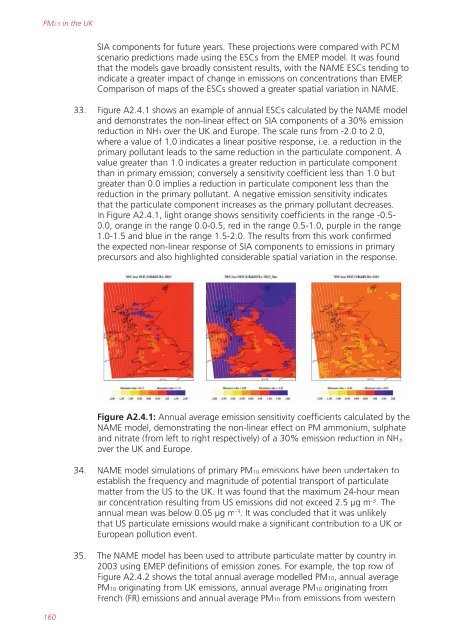
33. Figure A2.4.1 shows an example of annual ESCs calculated by the NAME model<br />
and demonstrates the non-l<strong>in</strong>ear effect on SIA components of a 30% emission<br />
reduction <strong>in</strong> NH3 over the UK and Europe. The scale runs from -2.0 to 2.0,<br />
where a value of 1.0 <strong>in</strong>dicates a l<strong>in</strong>ear positive response, i.e. a reduction <strong>in</strong> the<br />
primary pollutant leads to the same reduction <strong>in</strong> the <strong>particulate</strong> component. A<br />
value greater than 1.0 <strong>in</strong>dicates a greater reduction <strong>in</strong> <strong>particulate</strong> component<br />
than <strong>in</strong> primary emission; conversely a sensitivity coefficient less than 1.0 but<br />
greater than 0.0 implies a reduction <strong>in</strong> <strong>particulate</strong> component less than the<br />
reduction <strong>in</strong> the primary pollutant. A negative emission sensitivity <strong>in</strong>dicates<br />
that the <strong>particulate</strong> component <strong>in</strong>creases as the primary pollutant decreases.<br />
In Figure A2.4.1, light orange shows sensitivity coefficients <strong>in</strong> the range -0.5-<br />
0.0, orange <strong>in</strong> the range 0.0-0.5, red <strong>in</strong> the range 0.5-1.0, purple <strong>in</strong> the range<br />
1.0-1.5 and blue <strong>in</strong> the range 1.5-2.0. The results from this work confirmed<br />
the expected non-l<strong>in</strong>ear response of SIA components to emissions <strong>in</strong> primary<br />
precursors and also highlighted considerable spatial variation <strong>in</strong> the response.<br />
Figure A2.4.1: Annual average emission sensitivity coefficients calculated by the<br />
NAME model, demonstrat<strong>in</strong>g the non-l<strong>in</strong>ear effect on PM ammonium, sulphate<br />
and nitrate (from left to right respectively) of a 30% emission reduction <strong>in</strong> NH3<br />
over the UK and Europe.<br />
34. NAME model simulations of primary PM10 emissions have been undertaken to<br />
establish the frequency and magnitude of potential transport of <strong>particulate</strong><br />
<strong>matter</strong> from the US to the UK. It was found that the maximum 24-hour mean<br />
air concentration result<strong>in</strong>g from US emissions did not exceed 2.5 µg m -3 . The<br />
annual mean was below 0.05 µg m -3 . It was concluded that it was unlikely<br />
that US <strong>particulate</strong> emissions would make a significant contribution to a UK or<br />
European pollution event.<br />
35. The NAME model has been used to attribute <strong>particulate</strong> <strong>matter</strong> by country <strong>in</strong><br />
2003 us<strong>in</strong>g EMEP def<strong>in</strong>itions of emission zones. For example, the top row of<br />
Figure A2.4.2 shows the total annual average modelled PM10, annual average<br />
PM10 orig<strong>in</strong>at<strong>in</strong>g from UK emissions, annual average PM10 orig<strong>in</strong>at<strong>in</strong>g from<br />
French (FR) emissions and annual average PM10 from emissions from western


