

Air quality expert group - Fine particulate matter (PM2.5) in ... - Defra
Air quality expert group - Fine particulate matter (PM2.5) in ... - Defra
Air quality expert group - Fine particulate matter (PM2.5) in ... - Defra

Create successful ePaper yourself
Turn your PDF publications into a flip-book with our unique Google optimized e-Paper software.
l<strong>in</strong>e and po<strong>in</strong>t sources. But the same treatment used <strong>in</strong> the PCM model has<br />
been adopted for secondary organic aerosol and other PM components not<br />
covered <strong>in</strong> the emissions <strong>in</strong>ventory and thus not directly modelled. Total PM<br />
concentrations are calculated for each 1 km x 1 km grid square by add<strong>in</strong>g all the<br />
different contributions for the appropriate size fraction, PM10 or <strong>PM2.5</strong>. Bear<strong>in</strong>g<br />
<strong>in</strong> m<strong>in</strong>d the uncerta<strong>in</strong>ties of future projections, the treatment of roadside<br />
concentrations is aimed at an overall statistical comparison with air <strong>quality</strong> limit<br />
values across the UK, rather than accurate projections at specific locations as for<br />
example <strong>in</strong> ADMS. Roadside enhancement factors for street canyon effects are<br />
related to population density and roadside concentrations are calculated for the<br />
road with the highest emission density <strong>in</strong> each grid square. Results from UKIAM/<br />
BRUTAL were submitted for the <strong>Defra</strong> model <strong>in</strong>ter-comparison exercise, show<strong>in</strong>g<br />
comparable performance with other models.<br />
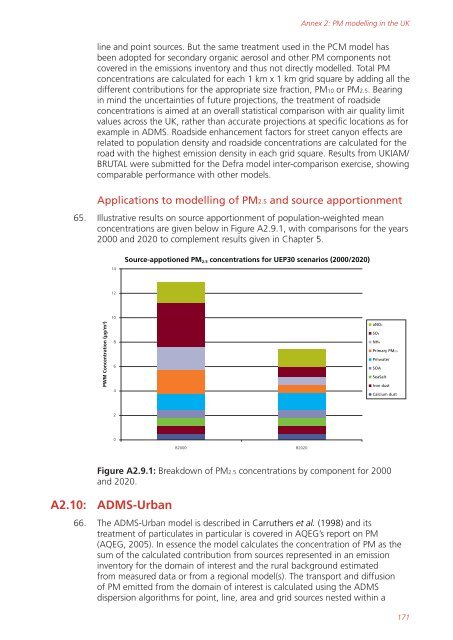
Applications to modell<strong>in</strong>g of <strong>PM2.5</strong> and source apportionment<br />
65. Illustrative results on source apportionment of population-weighted mean<br />
concentrations are given below <strong>in</strong> Figure A2.9.1, with comparisons for the years<br />
2000 and 2020 to complement results given <strong>in</strong> Chapter 5.<br />
PWM Concentration (µg/m 3)<br />
14<br />
12<br />
10<br />
8<br />
6<br />
4<br />
2<br />
0<br />
Source-appotioned <strong>PM2.5</strong> concentrations for UEP30 scenarios (2000/2020)<br />
B2000 B2020<br />
aNO3<br />
SO4<br />
NH4<br />
Primary <strong>PM2.5</strong><br />
Pmwater<br />
SOA<br />
SeaSalt<br />
Iron dust<br />
Calcium dust<br />
Figure A2.9.1: Breakdown of <strong>PM2.5</strong> concentrations by component for 2000<br />
and 2020.<br />
A2.10: ADMS-Urban<br />
Annex 2: PM modell<strong>in</strong>g <strong>in</strong> the UK<br />
66. The ADMS-Urban model is described <strong>in</strong> Carruthers et al. (1998) and its<br />
treatment of <strong>particulate</strong>s <strong>in</strong> particular is covered <strong>in</strong> AQEG’s report on PM<br />
(AQEG, 2005). In essence the model calculates the concentration of PM as the<br />
sum of the calculated contribution from sources represented <strong>in</strong> an emission<br />
<strong>in</strong>ventory for the doma<strong>in</strong> of <strong>in</strong>terest and the rural background estimated<br />
from measured data or from a regional model(s). The transport and diffusion<br />
of PM emitted from the doma<strong>in</strong> of <strong>in</strong>terest is calculated us<strong>in</strong>g the ADMS<br />
dispersion algorithms for po<strong>in</strong>t, l<strong>in</strong>e, area and grid sources nested with<strong>in</strong> a<br />
171


