

Air quality expert group - Fine particulate matter (PM2.5) in ... - Defra
Air quality expert group - Fine particulate matter (PM2.5) in ... - Defra
Air quality expert group - Fine particulate matter (PM2.5) in ... - Defra

Create successful ePaper yourself
Turn your PDF publications into a flip-book with our unique Google optimized e-Paper software.
<strong>PM2.5</strong> <strong>in</strong> the UK<br />
Annex 2: PM modell<strong>in</strong>g <strong>in</strong> the UK<br />
146<br />
A2.1: Applications of CMAQ to PM-related projects at AEA<br />
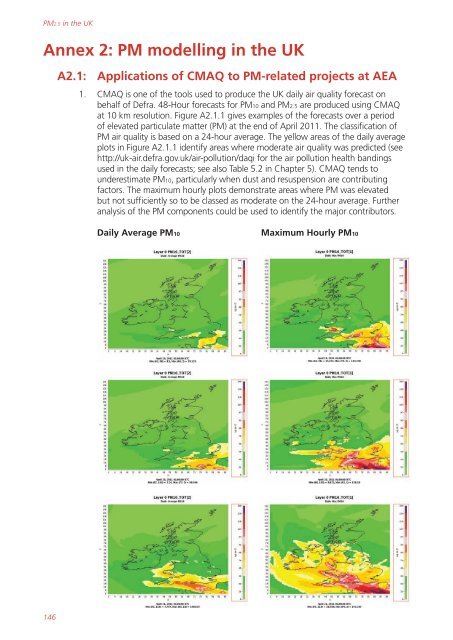
1. CMAQ is one of the tools used to produce the UK daily air <strong>quality</strong> forecast on<br />
behalf of <strong>Defra</strong>. 48-Hour forecasts for PM10 and <strong>PM2.5</strong> are produced us<strong>in</strong>g CMAQ<br />
at 10 km resolution. Figure A2.1.1 gives examples of the forecasts over a period<br />
of elevated <strong>particulate</strong> <strong>matter</strong> (PM) at the end of April 2011. The classification of<br />
PM air <strong>quality</strong> is based on a 24-hour average. The yellow areas of the daily average<br />
plots <strong>in</strong> Figure A2.1.1 identify areas where moderate air <strong>quality</strong> was predicted (see<br />
http://uk-air.defra.gov.uk/air-pollution/daqi for the air pollution health band<strong>in</strong>gs<br />
used <strong>in</strong> the daily forecasts; see also Table 5.2 <strong>in</strong> Chapter 5). CMAQ tends to<br />
underestimate PM10, particularly when dust and resuspension are contribut<strong>in</strong>g<br />
factors. The maximum hourly plots demonstrate areas where PM was elevated<br />
but not sufficiently so to be classed as moderate on the 24-hour average. Further<br />
analysis of the PM components could be used to identify the major contributors.<br />
Daily Average PM10 Maximum Hourly PM10


