

Air quality expert group - Fine particulate matter (PM2.5) in ... - Defra
Air quality expert group - Fine particulate matter (PM2.5) in ... - Defra
Air quality expert group - Fine particulate matter (PM2.5) in ... - Defra

Create successful ePaper yourself
Turn your PDF publications into a flip-book with our unique Google optimized e-Paper software.
<strong>PM2.5</strong> <strong>in</strong> the UK<br />
76<br />
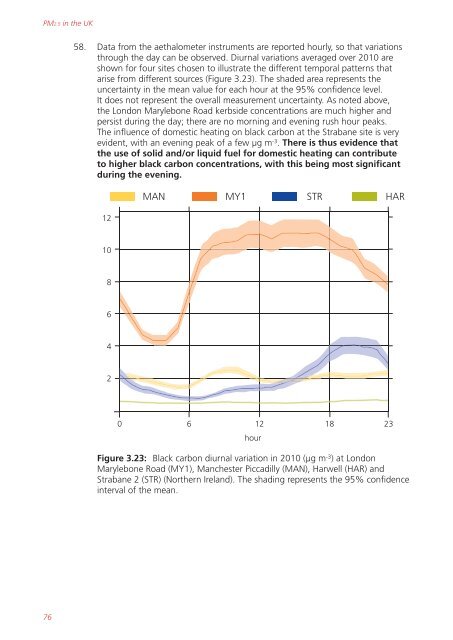
58. Data from the aethalometer <strong>in</strong>struments are reported hourly, so that variations<br />
through the day can be observed. Diurnal variations averaged over 2010 are<br />
shown for four sites chosen to illustrate the different temporal patterns that<br />
arise from different sources (Figure 3.23). The shaded area represents the<br />
uncerta<strong>in</strong>ty <strong>in</strong> the mean value for each hour at the 95% confidence level.<br />
It does not represent the overall measurement uncerta<strong>in</strong>ty. As noted above,<br />
the London Marylebone Road kerbside concentrations are much higher and<br />
persist dur<strong>in</strong>g the day; there are no morn<strong>in</strong>g and even<strong>in</strong>g rush hour peaks.<br />
The <strong>in</strong>fluence of domestic heat<strong>in</strong>g on black carbon at the Strabane site is very<br />
evident, with an even<strong>in</strong>g peak of a few µg m -3 . There is thus evidence that<br />
the use of solid and/or liquid fuel for domestic heat<strong>in</strong>g can contribute<br />
to higher black carbon concentrations, with this be<strong>in</strong>g most significant<br />
dur<strong>in</strong>g the even<strong>in</strong>g.<br />
12<br />
10<br />
8<br />
6<br />
4<br />
2<br />
0<br />
MAN MY1 STR HAR<br />
6 12<br />
hour<br />
18 23<br />
Figure 3.23: Black carbon diurnal variation <strong>in</strong> 2010 (µg m -3 ) at London<br />
Marylebone Road (MY1), Manchester Piccadilly (MAN), Harwell (HAR) and<br />
Strabane 2 (STR) (Northern Ireland). The shad<strong>in</strong>g represents the 95% confidence<br />
<strong>in</strong>terval of the mean.


