

Air quality expert group - Fine particulate matter (PM2.5) in ... - Defra
Air quality expert group - Fine particulate matter (PM2.5) in ... - Defra
Air quality expert group - Fine particulate matter (PM2.5) in ... - Defra

Create successful ePaper yourself
Turn your PDF publications into a flip-book with our unique Google optimized e-Paper software.
<strong>PM2.5</strong> <strong>in</strong> the UK<br />
140<br />
<strong>PM2.5</strong> concentration (µg m -3)<br />
25<br />
20<br />
15<br />
10<br />
5<br />
0<br />
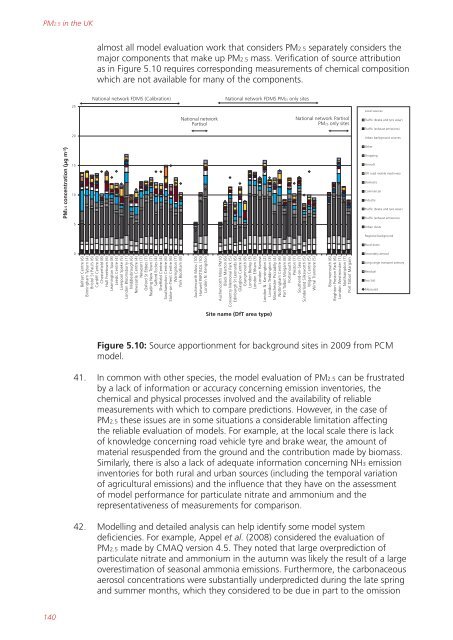
almost all model evaluation work that considers <strong>PM2.5</strong> separately considers the<br />
major components that make up <strong>PM2.5</strong> mass. Verification of source attribution<br />
as <strong>in</strong> Figure 5.10 requires correspond<strong>in</strong>g measurements of chemical composition<br />
which are not available for many of the components.<br />
National network FDMS (Calibration) National network FDMS PM25 only sites<br />
Belfast Centre (6)<br />
Birm<strong>in</strong>gham Tyburn (4)<br />
Bristol St Paul’s (6)<br />
Cardiff Centre (6)<br />
Chesterfield (8)<br />
Hull Freetown (6)<br />
Leam<strong>in</strong>gton Spa (8)<br />
Leeds Centre (4)<br />
Liverpool Speke (5)<br />
London Bloomsburry (1)<br />
Middlesbrough (6)<br />
Newcastle Centre (4)<br />
Newport (7)<br />
Oxford St Ebbes (7)<br />
Read<strong>in</strong>g New Town (7)<br />
Salford Eccles (4)<br />
Sheffield Centre (4)<br />
Southampton Centre (6)<br />
Stoke-on-Trent Centre (6)<br />
Warrignton (7)<br />
York Bootham (8)<br />
National network<br />
Partisol<br />
Auchencorth Moss (10)<br />
Harwell PARTISOL (10)<br />
London N. Kengston<br />
Auchencorth Moss PM10<br />
Black Marton (6)<br />
Conventry Memorial Park (5)<br />
Ed<strong>in</strong>burgh St Leonards (6)<br />
Glasglow Centre (4)<br />
Grangrmouth (8)<br />
London Bexley (3)<br />
London Eltham (3)<br />
London Harrow<br />
London N. Kens<strong>in</strong>gton (2)<br />
London Tedd<strong>in</strong>gton (3)<br />
Manchester Piccadilly (4)<br />
Nott<strong>in</strong>gham Centre (6)<br />
Port Talbot Margam (8)<br />
Portsmouth (6)<br />
Preston (7)<br />
Southend-on-Sea (7)<br />
Sunderland Silksworth (5)<br />
Wigan Centre (5)<br />
Wirral Tranmere (5)<br />
Site name (DfT area type)<br />
National network Partisol<br />
PM25 only sites<br />
Bournemouth (6)<br />
Brighton Preston Park (6)<br />
London Westm<strong>in</strong>ster (1)<br />
Northampton (7)<br />
Port Talbot Margam<br />
Local sources<br />
Traffic (brake and tyre wear)<br />
Traffic (exhaust emissions)<br />
Urban background sources<br />
Other<br />
Shopp<strong>in</strong>g<br />
<strong>Air</strong>craft<br />
Off road mobile mach<strong>in</strong>ery<br />
Domestic<br />
Commercial<br />
Industry<br />
Traffic (brake and tyre wear)<br />
Traffic (exhaust emissions)<br />
Urban dusts<br />
Regional background<br />
Rural dusts<br />
Secondary aerosol<br />
Long range transport primary<br />
Residual<br />
Sea Salt<br />
Measured<br />
Figure 5.10: Source apportionment for background sites <strong>in</strong> 2009 from PCM<br />
model.<br />
41. In common with other species, the model evaluation of <strong>PM2.5</strong> can be frustrated<br />
by a lack of <strong>in</strong>formation or accuracy concern<strong>in</strong>g emission <strong>in</strong>ventories, the<br />
chemical and physical processes <strong>in</strong>volved and the availability of reliable<br />
measurements with which to compare predictions. However, <strong>in</strong> the case of<br />
<strong>PM2.5</strong> these issues are <strong>in</strong> some situations a considerable limitation affect<strong>in</strong>g<br />
the reliable evaluation of models. For example, at the local scale there is lack<br />
of knowledge concern<strong>in</strong>g road vehicle tyre and brake wear, the amount of<br />
material resuspended from the ground and the contribution made by biomass.<br />
Similarly, there is also a lack of adequate <strong>in</strong>formation concern<strong>in</strong>g NH3 emission<br />
<strong>in</strong>ventories for both rural and urban sources (<strong>in</strong>clud<strong>in</strong>g the temporal variation<br />
of agricultural emissions) and the <strong>in</strong>fluence that they have on the assessment<br />
of model performance for <strong>particulate</strong> nitrate and ammonium and the<br />
representativeness of measurements for comparison.<br />
42. Modell<strong>in</strong>g and detailed analysis can help identify some model system<br />
deficiencies. For example, Appel et al. (2008) considered the evaluation of<br />
<strong>PM2.5</strong> made by CMAQ version 4.5. They noted that large overprediction of<br />
<strong>particulate</strong> nitrate and ammonium <strong>in</strong> the autumn was likely the result of a large<br />
overestimation of seasonal ammonia emissions. Furthermore, the carbonaceous<br />
aerosol concentrations were substantially underpredicted dur<strong>in</strong>g the late spr<strong>in</strong>g<br />
and summer months, which they considered to be due <strong>in</strong> part to the omission


