

Air quality expert group - Fine particulate matter (PM2.5) in ... - Defra
Air quality expert group - Fine particulate matter (PM2.5) in ... - Defra
Air quality expert group - Fine particulate matter (PM2.5) in ... - Defra

You also want an ePaper? Increase the reach of your titles
YUMPU automatically turns print PDFs into web optimized ePapers that Google loves.
<strong>PM2.5</strong> <strong>in</strong> the UK<br />
158<br />
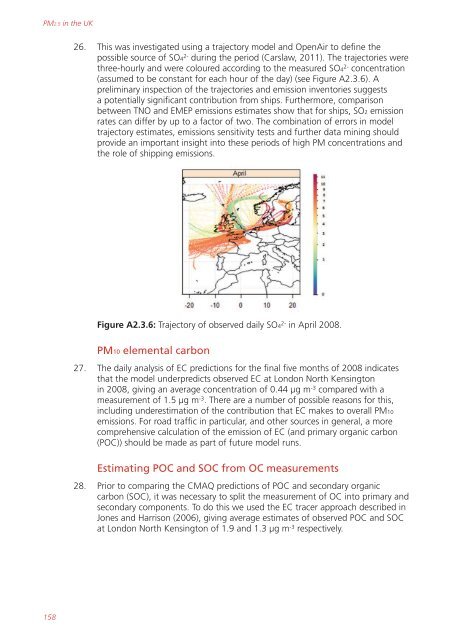
26. This was <strong>in</strong>vestigated us<strong>in</strong>g a trajectory model and Open<strong>Air</strong> to def<strong>in</strong>e the<br />
possible source of SO4 2- dur<strong>in</strong>g the period (Carslaw, 2011). The trajectories were<br />
three-hourly and were coloured accord<strong>in</strong>g to the measured SO4 2- concentration<br />
(assumed to be constant for each hour of the day) (see Figure A2.3.6). A<br />
prelim<strong>in</strong>ary <strong>in</strong>spection of the trajectories and emission <strong>in</strong>ventories suggests<br />
a potentially significant contribution from ships. Furthermore, comparison<br />
between TNO and EMEP emissions estimates show that for ships, SO2 emission<br />
rates can differ by up to a factor of two. The comb<strong>in</strong>ation of errors <strong>in</strong> model<br />
trajectory estimates, emissions sensitivity tests and further data m<strong>in</strong><strong>in</strong>g should<br />
provide an important <strong>in</strong>sight <strong>in</strong>to these periods of high PM concentrations and<br />
the role of shipp<strong>in</strong>g emissions.<br />
Figure A2.3.6: Trajectory of observed daily SO4 2- <strong>in</strong> April 2008.<br />
PM10 elemental carbon<br />
27. The daily analysis of EC predictions for the f<strong>in</strong>al five months of 2008 <strong>in</strong>dicates<br />
that the model underpredicts observed EC at London North Kens<strong>in</strong>gton<br />
<strong>in</strong> 2008, giv<strong>in</strong>g an average concentration of 0.44 µg m -3 compared with a<br />
measurement of 1.5 µg m -3 . There are a number of possible reasons for this,<br />
<strong>in</strong>clud<strong>in</strong>g underestimation of the contribution that EC makes to overall PM10<br />
emissions. For road traffic <strong>in</strong> particular, and other sources <strong>in</strong> general, a more<br />
comprehensive calculation of the emission of EC (and primary organic carbon<br />
(POC)) should be made as part of future model runs.<br />
Estimat<strong>in</strong>g POC and SOC from OC measurements<br />
28. Prior to compar<strong>in</strong>g the CMAQ predictions of POC and secondary organic<br />
carbon (SOC), it was necessary to split the measurement of OC <strong>in</strong>to primary and<br />
secondary components. To do this we used the EC tracer approach described <strong>in</strong><br />
Jones and Harrison (2006), giv<strong>in</strong>g average estimates of observed POC and SOC<br />
at London North Kens<strong>in</strong>gton of 1.9 and 1.3 µg m -3 respectively.


