- Page 1 and 2:
AIR QUALITY EXPERT GROUP Fine Parti
- Page 3 and 4:
This is a report from the Air Quali
- Page 5 and 6:
II Membership Chair Professor Paul
- Page 7 and 8:
IV Acknowledgements The Air Quality
- Page 9 and 10:
VI 2.5 Summary 39 2.5.1 What does t
- Page 11 and 12:
VIII 5.4 Components of PM2.5 and so
- Page 13 and 14:
PM2.5 in the UK 2 Air Quality Direc
- Page 15 and 16:
PM2.5 in the UK 4 I.2.1 Concentrati
- Page 17 and 18:
PM2.5 in the UK 6 • PM2.5 emissio
- Page 19 and 20:
PM2.5 in the UK 8 I.4.1 Modelling r
- Page 21 and 22:
PM2.5 in the UK 10 4. In broad term
- Page 23 and 24:
PM2.5 in the UK Table 1.2: National
- Page 25 and 26:
PM2.5 in the UK 14 17. Dry depositi
- Page 27 and 28:
PM2.5 in the UK 16 in ozone in the
- Page 29 and 30:
PM2.5 in the UK 18
- Page 31 and 32:
PM2.5 in the UK 20 5. The exact for
- Page 33 and 34:
PM2.5 in the UK 22 12. These diffic
- Page 35 and 36:
PM2.5 in the UK 24 2.3 Methods used
- Page 37 and 38:
PM2.5 in the UK 26 (e) During the
- Page 39 and 40:
PM2.5 in the UK 28 2.3.3 The Partis
- Page 41 and 42:
PM2.5 in the UK 30 35. For non-auto
- Page 43 and 44:
PM2.5 in the UK 32 43. Ratification
- Page 45 and 46:
PM2.5 in the UK 34 49. Many of the
- Page 47 and 48:
PM2.5 in the UK 36 57. Black carbon
- Page 49 and 50:
PM2.5 in the UK 38 2.4.4 PM2.5 elem
- Page 51 and 52:
PM2.5 in the UK 40 average of 93.6%
- Page 53 and 54:
PM2.5 in the UK Annex 1 - PM2.5 mon
- Page 55 and 56:
PM2.5 in the UK 44
- Page 57 and 58:
PM2.5 in the UK 46 3.2.1 Diurnal va
- Page 59 and 60:
PM2.5 in the UK 48 PM2.5/µgm -3 20
- Page 61 and 62:
PM2.5 in the UK 50 3.2.4 Seasonal v
- Page 63 and 64:
PM2.5 in the UK 52 12. Results are
- Page 65 and 66:
PM2.5 in the UK 54 3.4.2 Relationsh
- Page 67 and 68:
PM2.5 in the UK 56 Correlation 0.8
- Page 69 and 70:
PM2.5 in the UK Figure 3.11: Polar
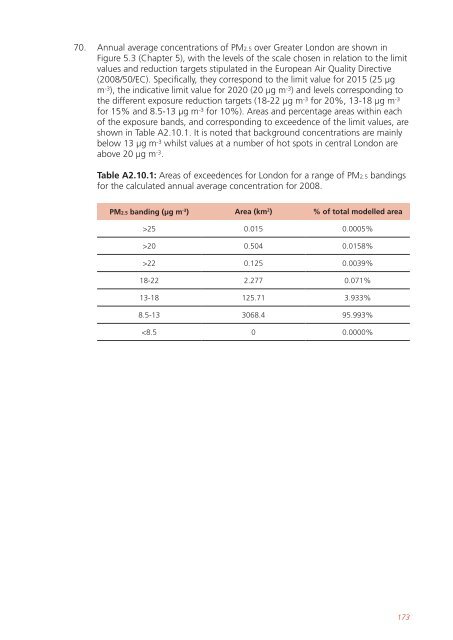
- Page 71 and 72:
PM2.5 in the UK 60 south. Further a
- Page 73 and 74:
PM2.5 in the UK 62 3.7 PM2.5 episod
- Page 75 and 76:
PM2.5 in the UK 64 secondary ammoni
- Page 77 and 78:
PM2.5 in the UK 66 3.8 PM2.5 concen
- Page 79 and 80:
PM2.5 in the UK 68 3.9 Composition
- Page 81 and 82:
PM2.5 in the UK 70 43. The UK has i
- Page 83 and 84:
PM2.5 in the UK 72 NO 3 6 4 2 2000
- Page 85 and 86:
PM2.5 in the UK 74 54. PM ammonium
- Page 87 and 88:
PM2.5 in the UK 76 58. Data from th
- Page 89 and 90:
PM2.5 in the UK 78 (k) Road traffic
- Page 91 and 92:
PM2.5 in the UK 80 provided by spec
- Page 93 and 94:
PM2.5 in the UK 82 14. The London L
- Page 95 and 96:
PM2.5 in the UK Table 4.1: UK emiss
- Page 97 and 98:
PM2.5 in the UK 86 24. National inv
- Page 99 and 100:
PM2.5 in the UK 88 Figure 4.5: Spat
- Page 101 and 102:
PM2.5 in the UK 90 either nanoparti
- Page 103 and 104:
PM2.5 in the UK 92 37. Further cons
- Page 105 and 106:
PM2.5 in the UK Emissions (ktonnes)
- Page 107 and 108:
PM2.5 in the UK 96 Figure 4.7: Spat
- Page 109 and 110:
PM2.5 in the UK 98 4.4 A critical a
- Page 111 and 112:
PM2.5 in the UK 100 60. At a local
- Page 113 and 114:
PM2.5 in the UK 102 measurements an
- Page 115 and 116:
PM2.5 in the UK 104 4.5.2 Quantifyi
- Page 117 and 118:
PM2.5 in the UK 106 77. Early effor
- Page 119 and 120:
PM2.5 in the UK 108 4.6.1 Receptor
- Page 121 and 122:
PM2.5 in the UK 110 is predicated o
- Page 123 and 124:
PM2.5 in the UK 112 PM2.5 contribut
- Page 125 and 126:
PM2.5 in the UK 114 inorganic parti
- Page 127 and 128:
PM2.5 in the UK 116 93. While there
- Page 129 and 130:
PM2.5 in the UK 118 100% 90% 80% 70
- Page 131 and 132:
PM2.5 in the UK 120 105. Receptor m
- Page 133 and 134: PM2.5 in the UK 122
- Page 135 and 136: PM2.5 in the UK 124 5. At the regio
- Page 137 and 138: PM2.5 in the UK 126 15. Some of the
- Page 139 and 140: PM2.5 in the UK 128 Figure 5.2: Tot
- Page 141 and 142: PM2.5 in the UK 130 µgm -3 160 140
- Page 143 and 144: PM2.5 in the UK 132 PM component (
- Page 145 and 146: PM2.5 in the UK 134 with larger dev
- Page 147 and 148: PM2.5 in the UK 136 Figure 5.8: UKI
- Page 149 and 150: PM2.5 in the UK Figure 5.9: Compari
- Page 151 and 152: PM2.5 in the UK 140 PM2.5 concentra
- Page 153 and 154: PM2.5 in the UK 142 the North Sea (
- Page 155 and 156: PM2.5 in the UK 144 53. Modelling r
- Page 157 and 158: PM2.5 in the UK Annex 2: PM modelli
- Page 159 and 160: PM2.5 in the UK 148 2. Figure A2.1.
- Page 161 and 162: PM2.5 in the UK 150 6. The non-line
- Page 163 and 164: PM2.5 in the UK 152 Model 50 45 40
- Page 165 and 166: PM2.5 in the UK 154 (a) (b) modPM 2
- Page 167 and 168: PM2.5 in the UK 156 NO3 - concentra
- Page 169 and 170: PM2.5 in the UK 158 26. This was in
- Page 171 and 172: PM2.5 in the UK 160 SIA components
- Page 173 and 174: PM2.5 in the UK 162 x 50 km grid fo
- Page 175 and 176: PM2.5 in the UK 164 A2.6: Photochem
- Page 177 and 178: PM2.5 in the UK 166 PM2.5 Emission
- Page 179 and 180: PM2.5 in the UK 168 A2.8: PCM PM mo
- Page 181 and 182: PM2.5 in the UK 170 illustrated by
- Page 183: PM2.5 in the UK 172 trajectory mode
- Page 187 and 188: PM2.5 in the UK 176 4. The delivery
- Page 189 and 190: PM2.5 in the UK 178 12. With respec
- Page 191 and 192: PM2.5 in the UK 180
- Page 193 and 194: PM2.5 in the UK Chapter 2: Measurin
- Page 195 and 196: PM2.5 in the UK RoTAP (2012). Revie
- Page 197 and 198: PM2.5 in the UK Harrison R.M. and Y
- Page 199 and 200: PM2.5 in the UK Chapter 5 Modelling
- Page 201 and 202: PM2.5 in the UK Jones A.M., Harriso
- Page 203: PB13837 Nobel House 17 Smith Square