

Air quality expert group - Fine particulate matter (PM2.5) in ... - Defra
Air quality expert group - Fine particulate matter (PM2.5) in ... - Defra
Air quality expert group - Fine particulate matter (PM2.5) in ... - Defra

You also want an ePaper? Increase the reach of your titles
YUMPU automatically turns print PDFs into web optimized ePapers that Google loves.
<strong>PM2.5</strong> <strong>in</strong> the UK<br />
166<br />
<strong>PM2.5</strong> Emission sensitivity coefficient<br />
0.35<br />
0.30<br />
0.25<br />
0.20<br />
0.15<br />
0.10<br />
0.05<br />
0.00<br />
-0.05<br />
SOx NOx VOC NH3 CO EC OC<br />
Emitted species<br />
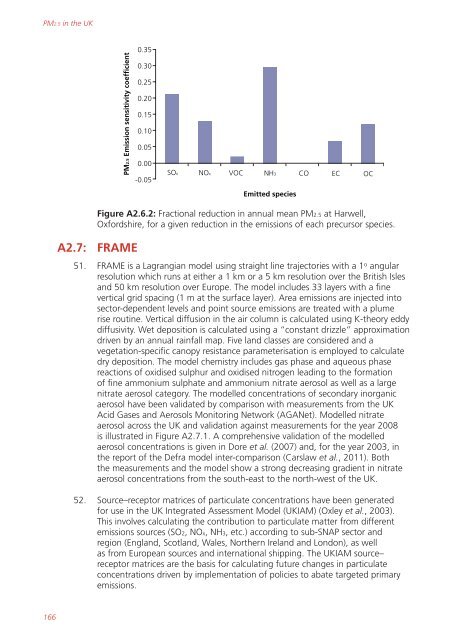
Figure A2.6.2: Fractional reduction <strong>in</strong> annual mean <strong>PM2.5</strong> at Harwell,<br />
Oxfordshire, for a given reduction <strong>in</strong> the emissions of each precursor species.<br />
A2.7: FRAME<br />
51. FRAME is a Lagrangian model us<strong>in</strong>g straight l<strong>in</strong>e trajectories with a 1 o angular<br />
resolution which runs at either a 1 km or a 5 km resolution over the British Isles<br />
and 50 km resolution over Europe. The model <strong>in</strong>cludes 33 layers with a f<strong>in</strong>e<br />
vertical grid spac<strong>in</strong>g (1 m at the surface layer). Area emissions are <strong>in</strong>jected <strong>in</strong>to<br />
sector-dependent levels and po<strong>in</strong>t source emissions are treated with a plume<br />
rise rout<strong>in</strong>e. Vertical diffusion <strong>in</strong> the air column is calculated us<strong>in</strong>g K-theory eddy<br />
diffusivity. Wet deposition is calculated us<strong>in</strong>g a “constant drizzle” approximation<br />
driven by an annual ra<strong>in</strong>fall map. Five land classes are considered and a<br />
vegetation-specific canopy resistance parameterisation is employed to calculate<br />
dry deposition. The model chemistry <strong>in</strong>cludes gas phase and aqueous phase<br />
reactions of oxidised sulphur and oxidised nitrogen lead<strong>in</strong>g to the formation<br />
of f<strong>in</strong>e ammonium sulphate and ammonium nitrate aerosol as well as a large<br />
nitrate aerosol category. The modelled concentrations of secondary <strong>in</strong>organic<br />
aerosol have been validated by comparison with measurements from the UK<br />
Acid Gases and Aerosols Monitor<strong>in</strong>g Network (AGANet). Modelled nitrate<br />
aerosol across the UK and validation aga<strong>in</strong>st measurements for the year 2008<br />
is illustrated <strong>in</strong> Figure A2.7.1. A comprehensive validation of the modelled<br />
aerosol concentrations is given <strong>in</strong> Dore et al. (2007) and, for the year 2003, <strong>in</strong><br />
the report of the <strong>Defra</strong> model <strong>in</strong>ter-comparison (Carslaw et al., 2011). Both<br />
the measurements and the model show a strong decreas<strong>in</strong>g gradient <strong>in</strong> nitrate<br />
aerosol concentrations from the south-east to the north-west of the UK.<br />
52. Source–receptor matrices of <strong>particulate</strong> concentrations have been generated<br />
for use <strong>in</strong> the UK Integrated Assessment Model (UKIAM) (Oxley et al., 2003).<br />
This <strong>in</strong>volves calculat<strong>in</strong>g the contribution to <strong>particulate</strong> <strong>matter</strong> from different<br />
emissions sources (SO2, NOx, NH3, etc.) accord<strong>in</strong>g to sub-SNAP sector and<br />
region (England, Scotland, Wales, Northern Ireland and London), as well<br />
as from European sources and <strong>in</strong>ternational shipp<strong>in</strong>g. The UKIAM source–<br />
receptor matrices are the basis for calculat<strong>in</strong>g future changes <strong>in</strong> <strong>particulate</strong><br />
concentrations driven by implementation of policies to abate targeted primary<br />
emissions.


