

Air quality expert group - Fine particulate matter (PM2.5) in ... - Defra
Air quality expert group - Fine particulate matter (PM2.5) in ... - Defra
Air quality expert group - Fine particulate matter (PM2.5) in ... - Defra

Create successful ePaper yourself
Turn your PDF publications into a flip-book with our unique Google optimized e-Paper software.
<strong>PM2.5</strong> <strong>in</strong> the UK<br />
86<br />
24. National <strong>in</strong>ventories provide an overall trend <strong>in</strong> emissions over time and <strong>in</strong>dicate<br />
the contribution made by difference sources. <strong>Air</strong> pollution models require<br />
<strong>in</strong>formation on the spatial variability <strong>in</strong> source emissions. This is illustrated for<br />
the UK <strong>in</strong> Figure 4.5, which shows the distribution of total <strong>PM2.5</strong> emissions <strong>in</strong><br />
2009 on a 1 km x 1 km grid, as provided by the NAEI. 4 The methodology used<br />
for mapp<strong>in</strong>g emissions from different sources is provided by Bush et al. (2010).<br />
The map shows the dom<strong>in</strong>ance of major urban centres and road networks.<br />
The emissions shown around the UK coast are from shipp<strong>in</strong>g. The emissions<br />
are taken from implementation of the spatially-resolved <strong>in</strong>ventory of emissions<br />
from shipp<strong>in</strong>g <strong>in</strong> 2007 developed by Entec (Entec, 2010), rescaled to 2009 and<br />
cover<strong>in</strong>g an area 12 nautical miles from the coast. These are not the same as the<br />
shipp<strong>in</strong>g emissions <strong>in</strong>cluded <strong>in</strong> Figure 4.1 and Table 4.1 as ‘national navigation’.<br />
The figures reported there refer to the def<strong>in</strong>ition of national shipp<strong>in</strong>g emissions<br />
specified by CLRTAP for national <strong>in</strong>ventory report<strong>in</strong>g. Here, national shipp<strong>in</strong>g<br />
emissions are def<strong>in</strong>ed as emissions from coastal shipp<strong>in</strong>g between UK ports<br />
regardless of the distance the vessel sails from the coast and excludes emissions<br />
from <strong>in</strong>ternational shipp<strong>in</strong>g movements.<br />
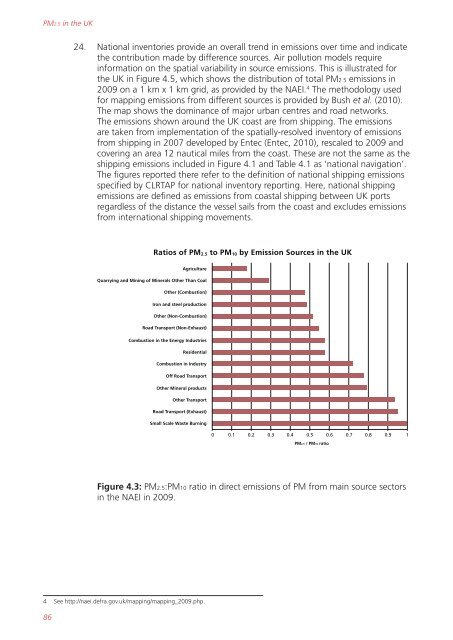
Ratios of <strong>PM2.5</strong> to PM10 by Emission Sources <strong>in</strong> the UK<br />
Agriculture<br />
Quarry<strong>in</strong>g and M<strong>in</strong><strong>in</strong>g of M<strong>in</strong>erals Other Than Coal<br />
Other (Combustion)<br />
Iron and steel production<br />
Other (Non-Combustion)<br />
Road Transport (Non-Exhaust)<br />
Combustion <strong>in</strong> the Energy Industries<br />
Residential<br />
Combustion <strong>in</strong> Industry<br />
Off Road Transport<br />
Other M<strong>in</strong>eral products<br />
Other Transport<br />
Road Transport (Exhaust)<br />
Small Scale Waste Burn<strong>in</strong>g<br />
0 0.1 0.2 0.3 0.4 0.5 0.6 0.7 0.8 0.9 1<br />
<strong>PM2.5</strong> / PM10 ratio<br />
Figure 4.3: <strong>PM2.5</strong>:PM10 ratio <strong>in</strong> direct emissions of PM from ma<strong>in</strong> source sectors<br />
<strong>in</strong> the NAEI <strong>in</strong> 2009.<br />
4 See http://naei.defra.gov.uk/mapp<strong>in</strong>g/mapp<strong>in</strong>g_2009.php.


