

Air quality expert group - Fine particulate matter (PM2.5) in ... - Defra
Air quality expert group - Fine particulate matter (PM2.5) in ... - Defra
Air quality expert group - Fine particulate matter (PM2.5) in ... - Defra

You also want an ePaper? Increase the reach of your titles
YUMPU automatically turns print PDFs into web optimized ePapers that Google loves.
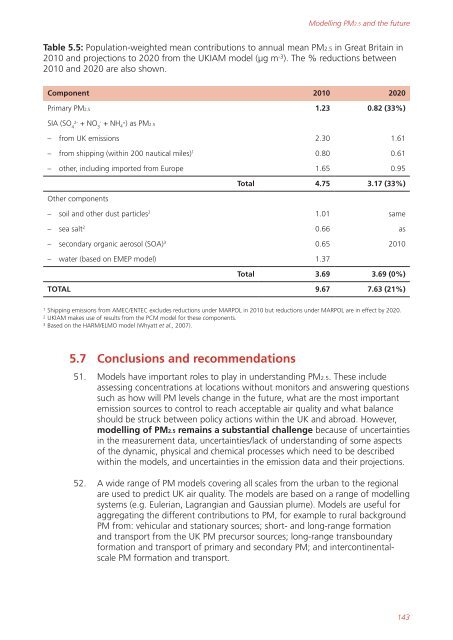
Table 5.5: Population-weighted mean contributions to annual mean <strong>PM2.5</strong> <strong>in</strong> Great Brita<strong>in</strong> <strong>in</strong><br />
2010 and projections to 2020 from the UKIAM model (µg m -3 ). The % reductions between<br />
2010 and 2020 are also shown.<br />
Component 2010 2020<br />
Primary <strong>PM2.5</strong> 1.23 0.82 (33%)<br />
SIA (SO 2- - + NO + NH4 +) as <strong>PM2.5</strong><br />
4 3<br />
– from UK emissions 2.30 1.61<br />
– from shipp<strong>in</strong>g (with<strong>in</strong> 200 nautical miles) 1 0.80 0.61<br />
– other, <strong>in</strong>clud<strong>in</strong>g imported from Europe 1.65 0.95<br />
Other components<br />
Total 4.75 3.17 (33%)<br />
– soil and other dust particles 2 1.01 same<br />
– sea salt 2 0.66 as<br />
– secondary organic aerosol (SOA) 3 0.65 2010<br />
– water (based on EMEP model) 1.37<br />
Total 3.69 3.69 (0%)<br />
TOTAL 9.67 7.63 (21%)<br />
1 Shipp<strong>in</strong>g emissions from AMEC/ENTEC excludes reductions under MARPOL <strong>in</strong> 2010 but reductions under MARPOL are <strong>in</strong> effect by 2020.<br />
2 UKIAM makes use of results from the PCM model for these components.<br />
3 Based on the HARM/ELMO model (Whyatt et al., 2007).<br />
5.7 Conclusions and recommendations<br />
Modell<strong>in</strong>g <strong>PM2.5</strong> and the future<br />
51. Models have important roles to play <strong>in</strong> understand<strong>in</strong>g <strong>PM2.5</strong>. These <strong>in</strong>clude<br />
assess<strong>in</strong>g concentrations at locations without monitors and answer<strong>in</strong>g questions<br />
such as how will PM levels change <strong>in</strong> the future, what are the most important<br />
emission sources to control to reach acceptable air <strong>quality</strong> and what balance<br />
should be struck between policy actions with<strong>in</strong> the UK and abroad. However,<br />
modell<strong>in</strong>g of <strong>PM2.5</strong> rema<strong>in</strong>s a substantial challenge because of uncerta<strong>in</strong>ties<br />
<strong>in</strong> the measurement data, uncerta<strong>in</strong>ties/lack of understand<strong>in</strong>g of some aspects<br />
of the dynamic, physical and chemical processes which need to be described<br />
with<strong>in</strong> the models, and uncerta<strong>in</strong>ties <strong>in</strong> the emission data and their projections.<br />
52. A wide range of PM models cover<strong>in</strong>g all scales from the urban to the regional<br />
are used to predict UK air <strong>quality</strong>. The models are based on a range of modell<strong>in</strong>g<br />
systems (e.g. Eulerian, Lagrangian and Gaussian plume). Models are useful for<br />
aggregat<strong>in</strong>g the different contributions to PM, for example to rural background<br />
PM from: vehicular and stationary sources; short- and long-range formation<br />
and transport from the UK PM precursor sources; long-range transboundary<br />
formation and transport of primary and secondary PM; and <strong>in</strong>tercont<strong>in</strong>entalscale<br />
PM formation and transport.<br />
143


