

Air quality expert group - Fine particulate matter (PM2.5) in ... - Defra
Air quality expert group - Fine particulate matter (PM2.5) in ... - Defra
Air quality expert group - Fine particulate matter (PM2.5) in ... - Defra

You also want an ePaper? Increase the reach of your titles
YUMPU automatically turns print PDFs into web optimized ePapers that Google loves.
concentration (µg m -3 )<br />
10.0<br />
7.5<br />
5.0<br />
2.5<br />
0.0<br />
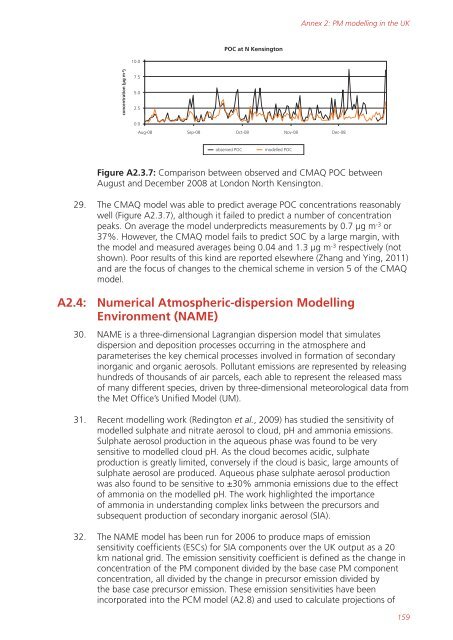
POC at N Kens<strong>in</strong>gton<br />
Aug-08 Sep-08 Oct-08 Nov-08 Dec-08<br />
observed POC modelled POC<br />
Figure A2.3.7: Comparison between observed and CMAQ POC between<br />
August and December 2008 at London North Kens<strong>in</strong>gton.<br />
29. The CMAQ model was able to predict average POC concentrations reasonably<br />
well (Figure A2.3.7), although it failed to predict a number of concentration<br />
peaks. On average the model underpredicts measurements by 0.7 µg m -3 or<br />
37%. However, the CMAQ model fails to predict SOC by a large marg<strong>in</strong>, with<br />
the model and measured averages be<strong>in</strong>g 0.04 and 1.3 µg m -3 respectively (not<br />
shown). Poor results of this k<strong>in</strong>d are reported elsewhere (Zhang and Y<strong>in</strong>g, 2011)<br />
and are the focus of changes to the chemical scheme <strong>in</strong> version 5 of the CMAQ<br />
model.<br />
A2.4: Numerical Atmospheric-dispersion Modell<strong>in</strong>g<br />
Environment (NAME)<br />
Annex 2: PM modell<strong>in</strong>g <strong>in</strong> the UK<br />
30. NAME is a three-dimensional Lagrangian dispersion model that simulates<br />
dispersion and deposition processes occurr<strong>in</strong>g <strong>in</strong> the atmosphere and<br />
parameterises the key chemical processes <strong>in</strong>volved <strong>in</strong> formation of secondary<br />
<strong>in</strong>organic and organic aerosols. Pollutant emissions are represented by releas<strong>in</strong>g<br />
hundreds of thousands of air parcels, each able to represent the released mass<br />
of many different species, driven by three-dimensional meteorological data from<br />
the Met Office’s Unified Model (UM).<br />
31. Recent modell<strong>in</strong>g work (Red<strong>in</strong>gton et al., 2009) has studied the sensitivity of<br />
modelled sulphate and nitrate aerosol to cloud, pH and ammonia emissions.<br />
Sulphate aerosol production <strong>in</strong> the aqueous phase was found to be very<br />
sensitive to modelled cloud pH. As the cloud becomes acidic, sulphate<br />
production is greatly limited, conversely if the cloud is basic, large amounts of<br />
sulphate aerosol are produced. Aqueous phase sulphate aerosol production<br />
was also found to be sensitive to ±30% ammonia emissions due to the effect<br />
of ammonia on the modelled pH. The work highlighted the importance<br />
of ammonia <strong>in</strong> understand<strong>in</strong>g complex l<strong>in</strong>ks between the precursors and<br />
subsequent production of secondary <strong>in</strong>organic aerosol (SIA).<br />
32. The NAME model has been run for 2006 to produce maps of emission<br />
sensitivity coefficients (ESCs) for SIA components over the UK output as a 20<br />
km national grid. The emission sensitivity coefficient is def<strong>in</strong>ed as the change <strong>in</strong><br />
concentration of the PM component divided by the base case PM component<br />
concentration, all divided by the change <strong>in</strong> precursor emission divided by<br />
the base case precursor emission. These emission sensitivities have been<br />
<strong>in</strong>corporated <strong>in</strong>to the PCM model (A2.8) and used to calculate projections of<br />
159


