

Air quality expert group - Fine particulate matter (PM2.5) in ... - Defra
Air quality expert group - Fine particulate matter (PM2.5) in ... - Defra
Air quality expert group - Fine particulate matter (PM2.5) in ... - Defra

You also want an ePaper? Increase the reach of your titles
YUMPU automatically turns print PDFs into web optimized ePapers that Google loves.
<strong>PM2.5</strong> <strong>in</strong> the UK<br />
74<br />
54. PM ammonium measurements switched to the Delta denuder method with<br />
nitrate <strong>in</strong> 2001. Aga<strong>in</strong>, no <strong>in</strong>formation on ammonium trends from the Delta<br />
network was presented <strong>in</strong> RoTAP (2012) reflect<strong>in</strong>g the large annual variability<br />
and the lack of any strong trends.<br />
Black smoke and black carbon<br />
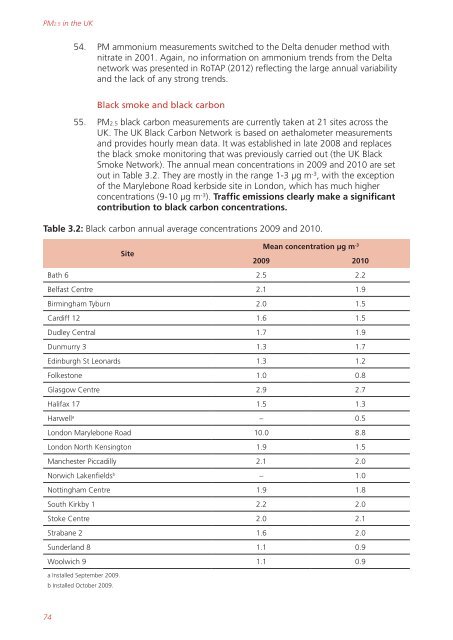
55. <strong>PM2.5</strong> black carbon measurements are currently taken at 21 sites across the<br />
UK. The UK Black Carbon Network is based on aethalometer measurements<br />
and provides hourly mean data. It was established <strong>in</strong> late 2008 and replaces<br />
the black smoke monitor<strong>in</strong>g that was previously carried out (the UK Black<br />
Smoke Network). The annual mean concentrations <strong>in</strong> 2009 and 2010 are set<br />
out <strong>in</strong> Table 3.2. They are mostly <strong>in</strong> the range 1-3 µg m -3 , with the exception<br />
of the Marylebone Road kerbside site <strong>in</strong> London, which has much higher<br />
concentrations (9-10 µg m -3 ). Traffic emissions clearly make a significant<br />
contribution to black carbon concentrations.<br />
Table 3.2: Black carbon annual average concentrations 2009 and 2010.<br />
Site<br />
Mean concentration µg m -3<br />
2009 2010<br />
Bath 6 2.5 2.2<br />
Belfast Centre 2.1 1.9<br />
Birm<strong>in</strong>gham Tyburn 2.0 1.5<br />
Cardiff 12 1.6 1.5<br />
Dudley Central 1.7 1.9<br />
Dunmurry 3 1.3 1.7<br />
Ed<strong>in</strong>burgh St Leonards 1.3 1.2<br />
Folkestone 1.0 0.8<br />
Glasgow Centre 2.9 2.7<br />
Halifax 17 1.5 1.3<br />
Harwell a – 0.5<br />
London Marylebone Road 10.0 8.8<br />
London North Kens<strong>in</strong>gton 1.9 1.5<br />
Manchester Piccadilly 2.1 2.0<br />
Norwich Lakenfields b – 1.0<br />
Nott<strong>in</strong>gham Centre 1.9 1.8<br />
South Kirkby 1 2.2 2.0<br />
Stoke Centre 2.0 2.1<br />
Strabane 2 1.6 2.0<br />
Sunderland 8 1.1 0.9<br />
Woolwich 9 1.1 0.9<br />
a Installed September 2009.<br />
b Installed October 2009.


