

Air quality expert group - Fine particulate matter (PM2.5) in ... - Defra
Air quality expert group - Fine particulate matter (PM2.5) in ... - Defra
Air quality expert group - Fine particulate matter (PM2.5) in ... - Defra

Create successful ePaper yourself
Turn your PDF publications into a flip-book with our unique Google optimized e-Paper software.
Modell<strong>in</strong>g <strong>PM2.5</strong> and the future<br />
17. The model calculations are consistent with rural background levels which are<br />
lowest <strong>in</strong> the north and west of the British Isles because of the greater geographical<br />
separation from the large UK and European PM sources. However, background<br />
levels do not decl<strong>in</strong>e to zero <strong>in</strong> either rural areas with negligible emissions or <strong>in</strong><br />
mar<strong>in</strong>e air masses arriv<strong>in</strong>g at the North Atlantic Ocean coastl<strong>in</strong>e of the British Isles.<br />
18. The models show that the contributions to rural background levels <strong>in</strong>clude the<br />
follow<strong>in</strong>g:<br />
• vehicular and stationary sources on the regional scale, <strong>in</strong>clud<strong>in</strong>g shipp<strong>in</strong>g;<br />
• short- and long-range formation and transport from UK PM precursor sources;<br />
• long-range transboundary formation and transport of primary and<br />
secondary PM;<br />
• <strong>in</strong>tercont<strong>in</strong>ental-scale PM formation and transport; and<br />
• natural background sources which are estimated <strong>in</strong> some models and which<br />
<strong>in</strong>clude sources such as secondary organic aerosol (SOA) from oceanic<br />
dimethyl sulphide (DMS), Saharan dusts, forest fires and volcanic eruptions.<br />
19. Figure 5.3 shows a calculation us<strong>in</strong>g ADMS-Urban of annual average <strong>PM2.5</strong><br />
concentrations across London for 2008, and <strong>in</strong>cludes an <strong>in</strong>set for concentrations<br />
<strong>in</strong> central London at higher resolution. In this study, as the ADMS-Urban model<br />
considers the rural background to be constant across the model doma<strong>in</strong> and<br />
the local generation of secondary <strong>particulate</strong>s is negligible, the variations <strong>in</strong><br />
concentrations <strong>in</strong> Figure 5.3 arise solely from primary emissions <strong>in</strong> the urban area.<br />
These comprise a number of contributions <strong>in</strong>clud<strong>in</strong>g emissions from road vehicles<br />
(combustion-derived particles, brake and tyre wear particles and resuspended<br />
road dusts), and also other combustion sources. The background annual average<br />
concentration rises towards the centre of the urban area with local peaks close to<br />
roads result<strong>in</strong>g from exhaust and non-exhaust road traffic emissions. This general<br />
pattern is typical for all significant urban areas <strong>in</strong> the UK.<br />
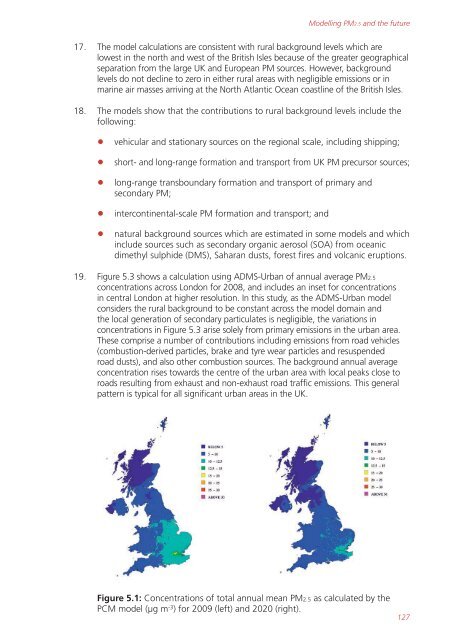
Figure 5.1: Concentrations of total annual mean <strong>PM2.5</strong> as calculated by the<br />
PCM model (µg m -3 ) for 2009 (left) and 2020 (right).<br />
127


