

Air quality expert group - Fine particulate matter (PM2.5) in ... - Defra
Air quality expert group - Fine particulate matter (PM2.5) in ... - Defra
Air quality expert group - Fine particulate matter (PM2.5) in ... - Defra

You also want an ePaper? Increase the reach of your titles
YUMPU automatically turns print PDFs into web optimized ePapers that Google loves.
<strong>PM2.5</strong> <strong>in</strong> the UK<br />
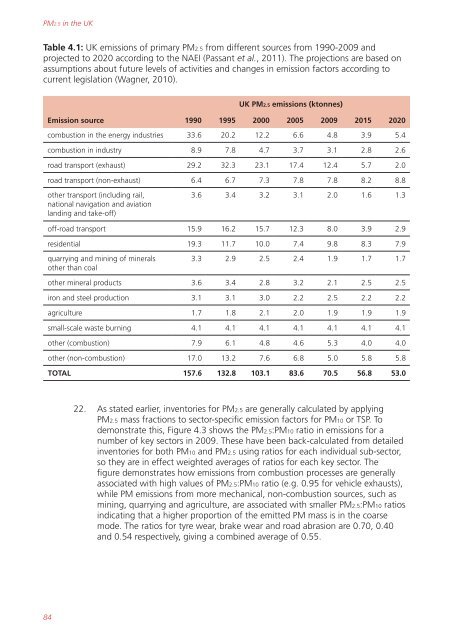
Table 4.1: UK emissions of primary <strong>PM2.5</strong> from different sources from 1990-2009 and<br />
projected to 2020 accord<strong>in</strong>g to the NAEI (Passant et al., 2011). The projections are based on<br />
assumptions about future levels of activities and changes <strong>in</strong> emission factors accord<strong>in</strong>g to<br />
current legislation (Wagner, 2010).<br />
84<br />
UK <strong>PM2.5</strong> emissions (ktonnes)<br />
Emission source 1990 1995 2000 2005 2009 2015 2020<br />
combustion <strong>in</strong> the energy <strong>in</strong>dustries 33.6 20.2 12.2 6.6 4.8 3.9 5.4<br />
combustion <strong>in</strong> <strong>in</strong>dustry 8.9 7.8 4.7 3.7 3.1 2.8 2.6<br />
road transport (exhaust) 29.2 32.3 23.1 17.4 12.4 5.7 2.0<br />
road transport (non-exhaust) 6.4 6.7 7.3 7.8 7.8 8.2 8.8<br />
other transport (<strong>in</strong>clud<strong>in</strong>g rail,<br />
national navigation and aviation<br />
land<strong>in</strong>g and take-off)<br />
3.6 3.4 3.2 3.1 2.0 1.6 1.3<br />
off-road transport 15.9 16.2 15.7 12.3 8.0 3.9 2.9<br />
residential 19.3 11.7 10.0 7.4 9.8 8.3 7.9<br />
quarry<strong>in</strong>g and m<strong>in</strong><strong>in</strong>g of m<strong>in</strong>erals<br />
other than coal<br />
3.3 2.9 2.5 2.4 1.9 1.7 1.7<br />
other m<strong>in</strong>eral products 3.6 3.4 2.8 3.2 2.1 2.5 2.5<br />
iron and steel production 3.1 3.1 3.0 2.2 2.5 2.2 2.2<br />
agriculture 1.7 1.8 2.1 2.0 1.9 1.9 1.9<br />
small-scale waste burn<strong>in</strong>g 4.1 4.1 4.1 4.1 4.1 4.1 4.1<br />
other (combustion) 7.9 6.1 4.8 4.6 5.3 4.0 4.0<br />
other (non-combustion) 17.0 13.2 7.6 6.8 5.0 5.8 5.8<br />
TOTAL 157.6 132.8 103.1 83.6 70.5 56.8 53.0<br />
22. As stated earlier, <strong>in</strong>ventories for <strong>PM2.5</strong> are generally calculated by apply<strong>in</strong>g<br />
<strong>PM2.5</strong> mass fractions to sector-specific emission factors for PM10 or TSP. To<br />
demonstrate this, Figure 4.3 shows the <strong>PM2.5</strong>:PM10 ratio <strong>in</strong> emissions for a<br />
number of key sectors <strong>in</strong> 2009. These have been back-calculated from detailed<br />
<strong>in</strong>ventories for both PM10 and <strong>PM2.5</strong> us<strong>in</strong>g ratios for each <strong>in</strong>dividual sub-sector,<br />
so they are <strong>in</strong> effect weighted averages of ratios for each key sector. The<br />
figure demonstrates how emissions from combustion processes are generally<br />
associated with high values of <strong>PM2.5</strong>:PM10 ratio (e.g. 0.95 for vehicle exhausts),<br />
while PM emissions from more mechanical, non-combustion sources, such as<br />
m<strong>in</strong><strong>in</strong>g, quarry<strong>in</strong>g and agriculture, are associated with smaller <strong>PM2.5</strong>:PM10 ratios<br />
<strong>in</strong>dicat<strong>in</strong>g that a higher proportion of the emitted PM mass is <strong>in</strong> the coarse<br />
mode. The ratios for tyre wear, brake wear and road abrasion are 0.70, 0.40<br />
and 0.54 respectively, giv<strong>in</strong>g a comb<strong>in</strong>ed average of 0.55.


