

Air quality expert group - Fine particulate matter (PM2.5) in ... - Defra
Air quality expert group - Fine particulate matter (PM2.5) in ... - Defra
Air quality expert group - Fine particulate matter (PM2.5) in ... - Defra

Create successful ePaper yourself
Turn your PDF publications into a flip-book with our unique Google optimized e-Paper software.
<strong>PM2.5</strong> <strong>in</strong> the UK<br />
164<br />
A2.6: Photochemical Trajectory Model (PTM)<br />
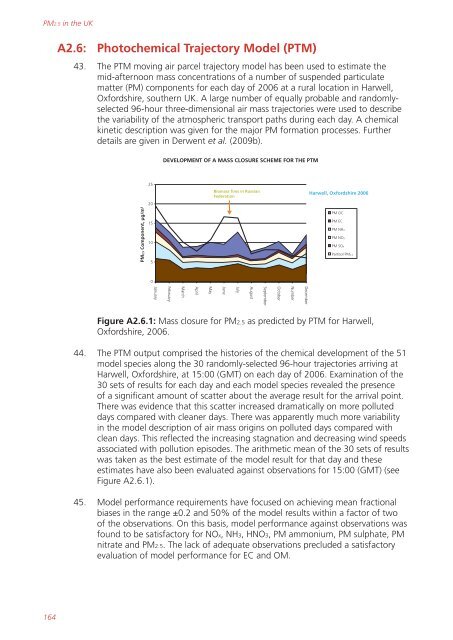
43. The PTM mov<strong>in</strong>g air parcel trajectory model has been used to estimate the<br />
mid-afternoon mass concentrations of a number of suspended <strong>particulate</strong><br />
<strong>matter</strong> (PM) components for each day of 2006 at a rural location <strong>in</strong> Harwell,<br />
Oxfordshire, southern UK. A large number of equally probable and randomlyselected<br />
96-hour three-dimensional air mass trajectories were used to describe<br />
the variability of the atmospheric transport paths dur<strong>in</strong>g each day. A chemical<br />
k<strong>in</strong>etic description was given for the major PM formation processes. Further<br />
details are given <strong>in</strong> Derwent et al. (2009b).<br />
<strong>PM2.5</strong> Component, µg/m 3<br />
25<br />
20<br />
15<br />
10<br />
5<br />
0<br />
January<br />
DEVELOPMENT OF A MASS CLOSURE SCHEME FOR THE PTM<br />
February<br />
March<br />
April<br />
May<br />
Biomass fires <strong>in</strong> Russian<br />
Federation<br />
June<br />
July<br />
August<br />
September<br />
October<br />
Number<br />
December<br />
Harwell, Oxfordshire 2006<br />
PM OC<br />
PM EC<br />
PM NH4<br />
PM NO3<br />
PM SO4<br />
Partisol <strong>PM2.5</strong><br />
Figure A2.6.1: Mass closure for <strong>PM2.5</strong> as predicted by PTM for Harwell,<br />
Oxfordshire, 2006.<br />
44. The PTM output comprised the histories of the chemical development of the 51<br />
model species along the 30 randomly-selected 96-hour trajectories arriv<strong>in</strong>g at<br />
Harwell, Oxfordshire, at 15:00 (GMT) on each day of 2006. Exam<strong>in</strong>ation of the<br />
30 sets of results for each day and each model species revealed the presence<br />
of a significant amount of scatter about the average result for the arrival po<strong>in</strong>t.<br />
There was evidence that this scatter <strong>in</strong>creased dramatically on more polluted<br />
days compared with cleaner days. There was apparently much more variability<br />
<strong>in</strong> the model description of air mass orig<strong>in</strong>s on polluted days compared with<br />
clean days. This reflected the <strong>in</strong>creas<strong>in</strong>g stagnation and decreas<strong>in</strong>g w<strong>in</strong>d speeds<br />
associated with pollution episodes. The arithmetic mean of the 30 sets of results<br />
was taken as the best estimate of the model result for that day and these<br />
estimates have also been evaluated aga<strong>in</strong>st observations for 15:00 (GMT) (see<br />
Figure A2.6.1).<br />
45. Model performance requirements have focused on achiev<strong>in</strong>g mean fractional<br />
biases <strong>in</strong> the range ±0.2 and 50% of the model results with<strong>in</strong> a factor of two<br />
of the observations. On this basis, model performance aga<strong>in</strong>st observations was<br />
found to be satisfactory for NOx, NH3, HNO3, PM ammonium, PM sulphate, PM<br />
nitrate and <strong>PM2.5</strong>. The lack of adequate observations precluded a satisfactory<br />
evaluation of model performance for EC and OM.


