

Air quality expert group - Fine particulate matter (PM2.5) in ... - Defra
Air quality expert group - Fine particulate matter (PM2.5) in ... - Defra
Air quality expert group - Fine particulate matter (PM2.5) in ... - Defra

You also want an ePaper? Increase the reach of your titles
YUMPU automatically turns print PDFs into web optimized ePapers that Google loves.
<strong>PM2.5</strong> <strong>in</strong> the UK<br />
56<br />
Correlation<br />
0.8<br />
0.6<br />
0.4<br />
0.2<br />
all data<br />
0 50<br />
100<br />
Distance (km)<br />
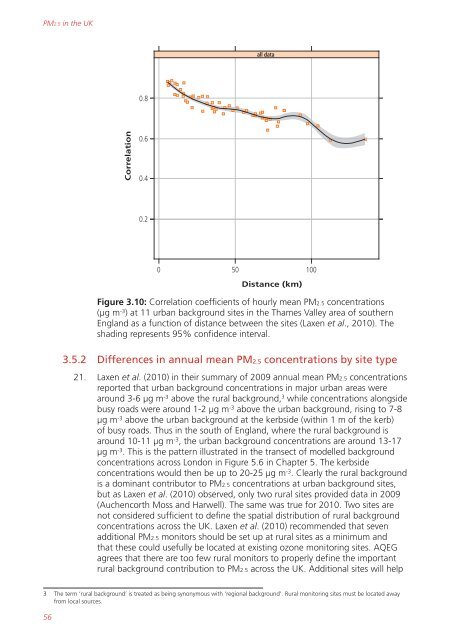
Figure 3.10: Correlation coefficients of hourly mean <strong>PM2.5</strong> concentrations<br />
(µg m -3 ) at 11 urban background sites <strong>in</strong> the Thames Valley area of southern<br />
England as a function of distance between the sites (Laxen et al., 2010). The<br />
shad<strong>in</strong>g represents 95% confidence <strong>in</strong>terval.<br />
3.5.2 Differences <strong>in</strong> annual mean <strong>PM2.5</strong> concentrations by site type<br />
21. Laxen et al. (2010) <strong>in</strong> their summary of 2009 annual mean <strong>PM2.5</strong> concentrations<br />
reported that urban background concentrations <strong>in</strong> major urban areas were<br />
around 3-6 µg m -3 above the rural background, 3 while concentrations alongside<br />
busy roads were around 1-2 µg m -3 above the urban background, ris<strong>in</strong>g to 7-8<br />
µg m -3 above the urban background at the kerbside (with<strong>in</strong> 1 m of the kerb)<br />
of busy roads. Thus <strong>in</strong> the south of England, where the rural background is<br />
around 10-11 µg m -3 , the urban background concentrations are around 13-17<br />
µg m -3 . This is the pattern illustrated <strong>in</strong> the transect of modelled background<br />
concentrations across London <strong>in</strong> Figure 5.6 <strong>in</strong> Chapter 5. The kerbside<br />
concentrations would then be up to 20-25 µg m -3 . Clearly the rural background<br />
is a dom<strong>in</strong>ant contributor to <strong>PM2.5</strong> concentrations at urban background sites,<br />
but as Laxen et al. (2010) observed, only two rural sites provided data <strong>in</strong> 2009<br />
(Auchencorth Moss and Harwell). The same was true for 2010. Two sites are<br />
not considered sufficient to def<strong>in</strong>e the spatial distribution of rural background<br />
concentrations across the UK. Laxen et al. (2010) recommended that seven<br />
additional <strong>PM2.5</strong> monitors should be set up at rural sites as a m<strong>in</strong>imum and<br />
that these could usefully be located at exist<strong>in</strong>g ozone monitor<strong>in</strong>g sites. AQEG<br />
agrees that there are too few rural monitors to properly def<strong>in</strong>e the important<br />
rural background contribution to <strong>PM2.5</strong> across the UK. Additional sites will help<br />
3 The term ‘rural background’ is treated as be<strong>in</strong>g synonymous with ‘regional background’. Rural monitor<strong>in</strong>g sites must be located away<br />
from local sources.


