

Air quality expert group - Fine particulate matter (PM2.5) in ... - Defra
Air quality expert group - Fine particulate matter (PM2.5) in ... - Defra
Air quality expert group - Fine particulate matter (PM2.5) in ... - Defra

You also want an ePaper? Increase the reach of your titles
YUMPU automatically turns print PDFs into web optimized ePapers that Google loves.
<strong>PM2.5</strong>/µgm -3<br />
20<br />
15<br />
10<br />
5<br />
Roadside<br />
0 5<br />
12<br />
hour<br />
18 23<br />
20<br />
15<br />
10<br />
5<br />
Concentrations and composition of <strong>PM2.5</strong><br />
Industrial<br />
0 5<br />
12<br />
hour<br />
18 23<br />
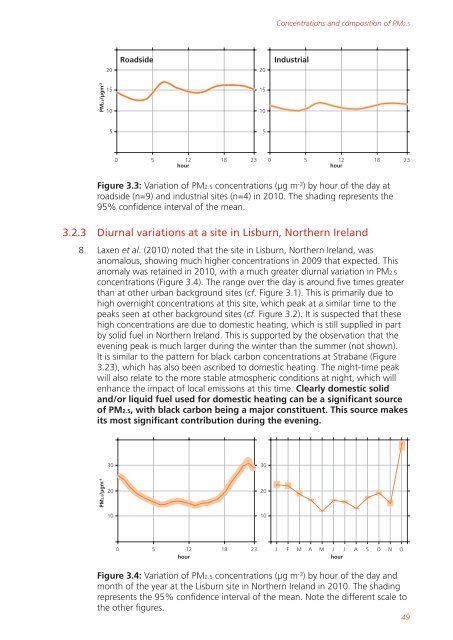
Figure 3.3: Variation of <strong>PM2.5</strong> concentrations (µg m -3 ) by hour of the day at<br />
roadside (n=9) and <strong>in</strong>dustrial sites (n=4) <strong>in</strong> 2010. The shad<strong>in</strong>g represents the<br />
95% confidence <strong>in</strong>terval of the mean.<br />
3.2.3 Diurnal variations at a site <strong>in</strong> Lisburn, Northern Ireland<br />
8. Laxen et al. (2010) noted that the site <strong>in</strong> Lisburn, Northern Ireland, was<br />
anomalous, show<strong>in</strong>g much higher concentrations <strong>in</strong> 2009 that expected. This<br />
anomaly was reta<strong>in</strong>ed <strong>in</strong> 2010, with a much greater diurnal variation <strong>in</strong> <strong>PM2.5</strong><br />
concentrations (Figure 3.4). The range over the day is around five times greater<br />
than at other urban background sites (cf. Figure 3.1). This is primarily due to<br />
high overnight concentrations at this site, which peak at a similar time to the<br />
peaks seen at other background sites (cf. Figure 3.2). It is suspected that these<br />
high concentrations are due to domestic heat<strong>in</strong>g, which is still supplied <strong>in</strong> part<br />
by solid fuel <strong>in</strong> Northern Ireland. This is supported by the observation that the<br />
even<strong>in</strong>g peak is much larger dur<strong>in</strong>g the w<strong>in</strong>ter than the summer (not shown).<br />
It is similar to the pattern for black carbon concentrations at Strabane (Figure<br />
3.23), which has also been ascribed to domestic heat<strong>in</strong>g. The night-time peak<br />
will also relate to the more stable atmospheric conditions at night, which will<br />
enhance the impact of local emissions at this time. Clearly domestic solid<br />
and/or liquid fuel used for domestic heat<strong>in</strong>g can be a significant source<br />
of <strong>PM2.5</strong>, with black carbon be<strong>in</strong>g a major constituent. This source makes<br />
its most significant contribution dur<strong>in</strong>g the even<strong>in</strong>g.<br />
<strong>PM2.5</strong>/µgm -3<br />
30<br />
20<br />
10<br />
0 5<br />
12<br />
hour<br />
18 23<br />
30<br />
20<br />
10<br />
J F M A M J<br />
hour<br />
J A S O N O<br />
Figure 3.4: Variation of <strong>PM2.5</strong> concentrations (µg m<br />
49<br />
-3 ) by hour of the day and<br />
month of the year at the Lisburn site <strong>in</strong> Northern Ireland <strong>in</strong> 2010. The shad<strong>in</strong>g<br />
represents the 95% confidence <strong>in</strong>terval of the mean. Note the different scale to<br />
the other figures.


