

Air quality expert group - Fine particulate matter (PM2.5) in ... - Defra
Air quality expert group - Fine particulate matter (PM2.5) in ... - Defra
Air quality expert group - Fine particulate matter (PM2.5) in ... - Defra

Create successful ePaper yourself
Turn your PDF publications into a flip-book with our unique Google optimized e-Paper software.
Modelled NO3 surface concentration (µg m -3)<br />
4<br />
3<br />
2<br />
1<br />
0<br />
0<br />
y = 1.18 x – 0.27, R 2 = 0.91<br />
NMB = – 0.03<br />
Annex 2: PM modell<strong>in</strong>g <strong>in</strong> the UK<br />
1 2 3 4<br />
Measured NO3 surface concentration (µg m -3)<br />
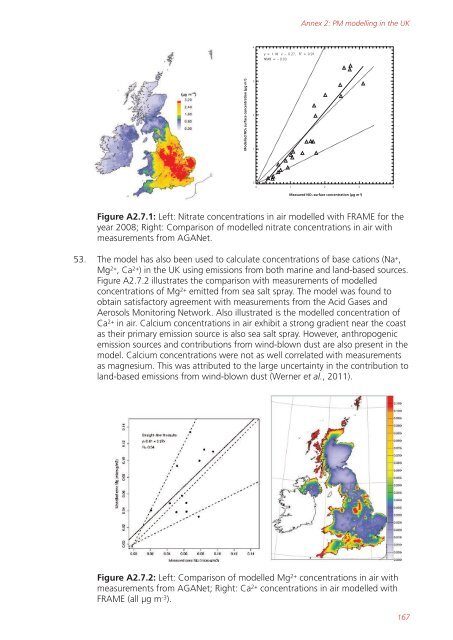
Figure A2.7.1: Left: Nitrate concentrations <strong>in</strong> air modelled with FRAME for the<br />
year 2008; Right: Comparison of modelled nitrate concentrations <strong>in</strong> air with<br />
measurements from AGANet.<br />
53. The model has also been used to calculate concentrations of base cations (Na + ,<br />
Mg 2+ , Ca 2+ ) <strong>in</strong> the UK us<strong>in</strong>g emissions from both mar<strong>in</strong>e and land-based sources.<br />
Figure A2.7.2 illustrates the comparison with measurements of modelled<br />
concentrations of Mg 2+ emitted from sea salt spray. The model was found to<br />
obta<strong>in</strong> satisfactory agreement with measurements from the Acid Gases and<br />
Aerosols Monitor<strong>in</strong>g Network. Also illustrated is the modelled concentration of<br />
Ca 2+ <strong>in</strong> air. Calcium concentrations <strong>in</strong> air exhibit a strong gradient near the coast<br />
as their primary emission source is also sea salt spray. However, anthropogenic<br />
emission sources and contributions from w<strong>in</strong>d-blown dust are also present <strong>in</strong> the<br />
model. Calcium concentrations were not as well correlated with measurements<br />
as magnesium. This was attributed to the large uncerta<strong>in</strong>ty <strong>in</strong> the contribution to<br />
land-based emissions from w<strong>in</strong>d-blown dust (Werner et al., 2011).<br />
Figure A2.7.2: Left: Comparison of modelled Mg 2+ concentrations <strong>in</strong> air with<br />
measurements from AGANet; Right: Ca 2+ concentrations <strong>in</strong> air modelled with<br />
FRAME (all µg m -3 ).<br />
167


