

Air quality expert group - Fine particulate matter (PM2.5) in ... - Defra
Air quality expert group - Fine particulate matter (PM2.5) in ... - Defra
Air quality expert group - Fine particulate matter (PM2.5) in ... - Defra

Create successful ePaper yourself
Turn your PDF publications into a flip-book with our unique Google optimized e-Paper software.
<strong>PM2.5</strong> <strong>in</strong> the UK<br />
152<br />
Model<br />
50<br />
45<br />
40<br />
35<br />
30<br />
25<br />
20<br />
15<br />
10<br />
5<br />
<strong>PM2.5</strong> JAN 2005 (HAR)<br />
0<br />
0 5 10 15 20 25 30 35 40 40 50<br />
Observation<br />
Model<br />
50<br />
45<br />
40<br />
35<br />
30<br />
25<br />
20<br />
15<br />
10<br />
5<br />
<strong>PM2.5</strong> JUL 2005 (HAR)<br />
0<br />
0 5 10 15 20 25 30 35 40 40 50<br />
Observation<br />
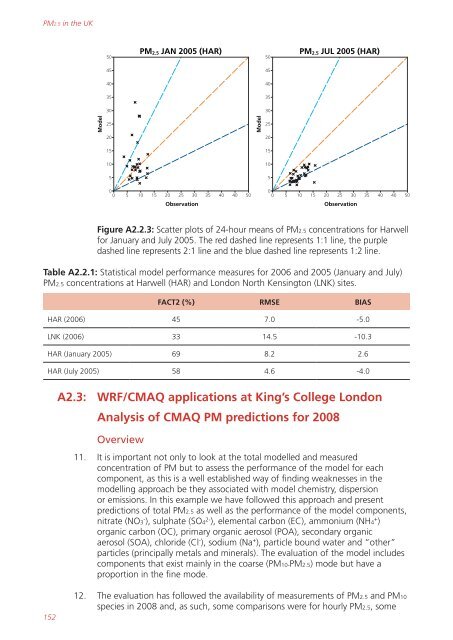
Figure A2.2.3: Scatter plots of 24-hour means of <strong>PM2.5</strong> concentrations for Harwell<br />
for January and July 2005. The red dashed l<strong>in</strong>e represents 1:1 l<strong>in</strong>e, the purple<br />
dashed l<strong>in</strong>e represents 2:1 l<strong>in</strong>e and the blue dashed l<strong>in</strong>e represents 1:2 l<strong>in</strong>e.<br />
Table A2.2.1: Statistical model performance measures for 2006 and 2005 (January and July)<br />
<strong>PM2.5</strong> concentrations at Harwell (HAR) and London North Kens<strong>in</strong>gton (LNK) sites.<br />
FACT2 (%) RMSE BIAS<br />
HAR (2006) 45 7.0 -5.0<br />
LNK (2006) 33 14.5 -10.3<br />
HAR (January 2005) 69 8.2 2.6<br />
HAR (July 2005) 58 4.6 -4.0<br />
A2.3: WRF/CMAQ applications at K<strong>in</strong>g’s College London<br />
Analysis of CMAQ PM predictions for 2008<br />
Overview<br />
11. It is important not only to look at the total modelled and measured<br />
concentration of PM but to assess the performance of the model for each<br />
component, as this is a well established way of f<strong>in</strong>d<strong>in</strong>g weaknesses <strong>in</strong> the<br />
modell<strong>in</strong>g approach be they associated with model chemistry, dispersion<br />
or emissions. In this example we have followed this approach and present<br />
predictions of total <strong>PM2.5</strong> as well as the performance of the model components,<br />
nitrate (NO3 - ), sulphate (SO4 2- ), elemental carbon (EC), ammonium (NH4 + )<br />
organic carbon (OC), primary organic aerosol (POA), secondary organic<br />
aerosol (SOA), chloride (Cl - ), sodium (Na + ), particle bound water and “other”<br />
particles (pr<strong>in</strong>cipally metals and m<strong>in</strong>erals). The evaluation of the model <strong>in</strong>cludes<br />
components that exist ma<strong>in</strong>ly <strong>in</strong> the coarse (PM10-<strong>PM2.5</strong>) mode but have a<br />
proportion <strong>in</strong> the f<strong>in</strong>e mode.<br />
12. The evaluation has followed the availability of measurements of <strong>PM2.5</strong> and PM10<br />
species <strong>in</strong> 2008 and, as such, some comparisons were for hourly <strong>PM2.5</strong>, some


