

Air quality expert group - Fine particulate matter (PM2.5) in ... - Defra
Air quality expert group - Fine particulate matter (PM2.5) in ... - Defra
Air quality expert group - Fine particulate matter (PM2.5) in ... - Defra

Create successful ePaper yourself
Turn your PDF publications into a flip-book with our unique Google optimized e-Paper software.
<strong>PM2.5</strong> <strong>in</strong> the UK<br />
132<br />
PM component (µgm -3 )<br />
20<br />
18<br />
16<br />
14<br />
12<br />
10<br />
8<br />
6<br />
4<br />
2<br />
0<br />
Annual mean <strong>PM2.5</strong> transect across London for 2009 from PCM model<br />
470500<br />
473500<br />
476500<br />
479500<br />
482500<br />
485500<br />
488500<br />
491500<br />
494500<br />
497500<br />
500500<br />
503500<br />
506500<br />
509500<br />
512500<br />
515500<br />
518500<br />
521500<br />
524500<br />
527500<br />
530500<br />
533500<br />
536500<br />
539500<br />
542500<br />
545500<br />
548500<br />
551500<br />
554500<br />
557500<br />
560500<br />
563500<br />
566500<br />
569500<br />
572500<br />
575500<br />
578500<br />
581500<br />
East<strong>in</strong>g (m)<br />
traffic area sources<br />
non-traffic area sources<br />
po<strong>in</strong>t sources<br />
urban dust<br />
rural dust<br />
regional primary<br />
secondary organic<br />
secondary <strong>in</strong>organic<br />
residual<br />
sea salt<br />
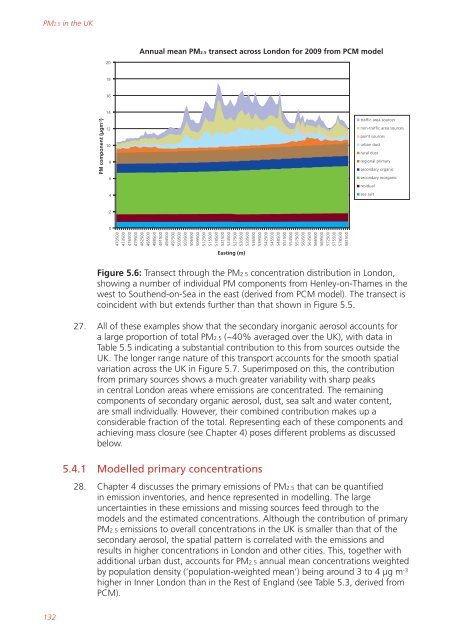
Figure 5.6: Transect through the <strong>PM2.5</strong> concentration distribution <strong>in</strong> London,<br />
show<strong>in</strong>g a number of <strong>in</strong>dividual PM components from Henley-on-Thames <strong>in</strong> the<br />
west to Southend-on-Sea <strong>in</strong> the east (derived from PCM model). The transect is<br />
co<strong>in</strong>cident with but extends further than that shown <strong>in</strong> Figure 5.5.<br />
27. All of these examples show that the secondary <strong>in</strong>organic aerosol accounts for<br />
a large proportion of total <strong>PM2.5</strong> (~40% averaged over the UK), with data <strong>in</strong><br />
Table 5.5 <strong>in</strong>dicat<strong>in</strong>g a substantial contribution to this from sources outside the<br />
UK. The longer range nature of this transport accounts for the smooth spatial<br />
variation across the UK <strong>in</strong> Figure 5.7. Superimposed on this, the contribution<br />
from primary sources shows a much greater variability with sharp peaks<br />
<strong>in</strong> central London areas where emissions are concentrated. The rema<strong>in</strong><strong>in</strong>g<br />
components of secondary organic aerosol, dust, sea salt and water content,<br />
are small <strong>in</strong>dividually. However, their comb<strong>in</strong>ed contribution makes up a<br />
considerable fraction of the total. Represent<strong>in</strong>g each of these components and<br />
achiev<strong>in</strong>g mass closure (see Chapter 4) poses different problems as discussed<br />
below.<br />
5.4.1 Modelled primary concentrations<br />
28. Chapter 4 discusses the primary emissions of <strong>PM2.5</strong> that can be quantified<br />
<strong>in</strong> emission <strong>in</strong>ventories, and hence represented <strong>in</strong> modell<strong>in</strong>g. The large<br />
uncerta<strong>in</strong>ties <strong>in</strong> these emissions and miss<strong>in</strong>g sources feed through to the<br />
models and the estimated concentrations. Although the contribution of primary<br />
<strong>PM2.5</strong> emissions to overall concentrations <strong>in</strong> the UK is smaller than that of the<br />
secondary aerosol, the spatial pattern is correlated with the emissions and<br />
results <strong>in</strong> higher concentrations <strong>in</strong> London and other cities. This, together with<br />
additional urban dust, accounts for <strong>PM2.5</strong> annual mean concentrations weighted<br />
by population density (‘population-weighted mean’) be<strong>in</strong>g around 3 to 4 µg m -3<br />
higher <strong>in</strong> Inner London than <strong>in</strong> the Rest of England (see Table 5.3, derived from<br />
PCM).


