

Air quality expert group - Fine particulate matter (PM2.5) in ... - Defra
Air quality expert group - Fine particulate matter (PM2.5) in ... - Defra
Air quality expert group - Fine particulate matter (PM2.5) in ... - Defra

Create successful ePaper yourself
Turn your PDF publications into a flip-book with our unique Google optimized e-Paper software.
Concentrations and composition of <strong>PM2.5</strong><br />
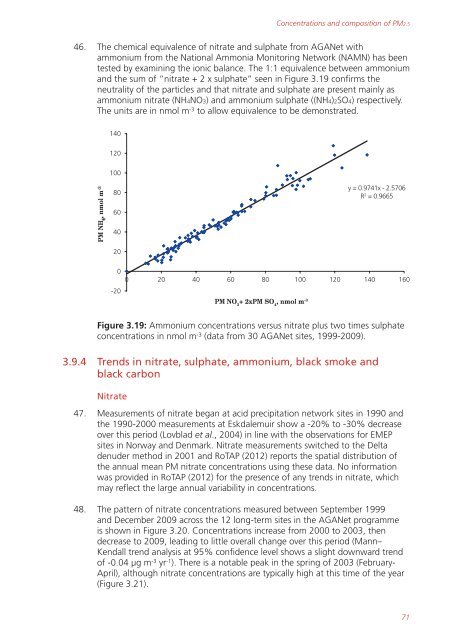
46. The chemical equivalence of nitrate and sulphate from AGANet with<br />
ammonium from the National Ammonia Monitor<strong>in</strong>g Network (NAMN) has been<br />
tested by exam<strong>in</strong><strong>in</strong>g the ionic balance. The 1:1 equivalence between ammonium<br />
and the sum of “nitrate + 2 x sulphate” seen <strong>in</strong> Figure 3.19 confirms the<br />
neutrality of the particles and that nitrate and sulphate are present ma<strong>in</strong>ly as<br />
ammonium nitrate (NH4NO3) and ammonium sulphate ((NH4)2SO4) respectively.<br />
The units are <strong>in</strong> nmol m -3 to allow equivalence to be demonstrated.<br />
-3<br />
PM NH4, nmol m<br />
4<br />
140<br />
120<br />
100<br />
80<br />
60<br />
40<br />
20<br />
0<br />
-20<br />
y = 0.9741x - 2.5706<br />
R 2 = 0.9665<br />
0 20 40 60 80 100 120 140 160<br />
PM NO 3 + 2xPM SO 4 , nmol m -3<br />
Figure 3.19: Ammonium concentrations versus nitrate plus two times sulphate<br />
concentrations <strong>in</strong> nmol m -3 (data from 30 AGANet sites, 1999-2009).<br />
3.9.4 Trends <strong>in</strong> nitrate, sulphate, ammonium, black smoke and<br />
black carbon<br />
Nitrate<br />
47. Measurements of nitrate began at acid precipitation network sites <strong>in</strong> 1990 and<br />
the 1990-2000 measurements at Eskdalemuir show a -20% to -30% decrease<br />
over this period (Lovblad et al., 2004) <strong>in</strong> l<strong>in</strong>e with the observations for EMEP<br />
sites <strong>in</strong> Norway and Denmark. Nitrate measurements switched to the Delta<br />
denuder method <strong>in</strong> 2001 and RoTAP (2012) reports the spatial distribution of<br />
the annual mean PM nitrate concentrations us<strong>in</strong>g these data. No <strong>in</strong>formation<br />
was provided <strong>in</strong> RoTAP (2012) for the presence of any trends <strong>in</strong> nitrate, which<br />
may reflect the large annual variability <strong>in</strong> concentrations.<br />
48. The pattern of nitrate concentrations measured between September 1999<br />
and December 2009 across the 12 long-term sites <strong>in</strong> the AGANet programme<br />
is shown <strong>in</strong> Figure 3.20. Concentrations <strong>in</strong>crease from 2000 to 2003, then<br />
decrease to 2009, lead<strong>in</strong>g to little overall change over this period (Mann–<br />
Kendall trend analysis at 95% confidence level shows a slight downward trend<br />
of -0.04 µg m -3 yr -1 ). There is a notable peak <strong>in</strong> the spr<strong>in</strong>g of 2003 (February-<br />
April), although nitrate concentrations are typically high at this time of the year<br />
(Figure 3.21).<br />
71


