

Air quality expert group - Fine particulate matter (PM2.5) in ... - Defra
Air quality expert group - Fine particulate matter (PM2.5) in ... - Defra
Air quality expert group - Fine particulate matter (PM2.5) in ... - Defra

You also want an ePaper? Increase the reach of your titles
YUMPU automatically turns print PDFs into web optimized ePapers that Google loves.
<strong>PM2.5</strong> emissions and receptor modell<strong>in</strong>g<br />
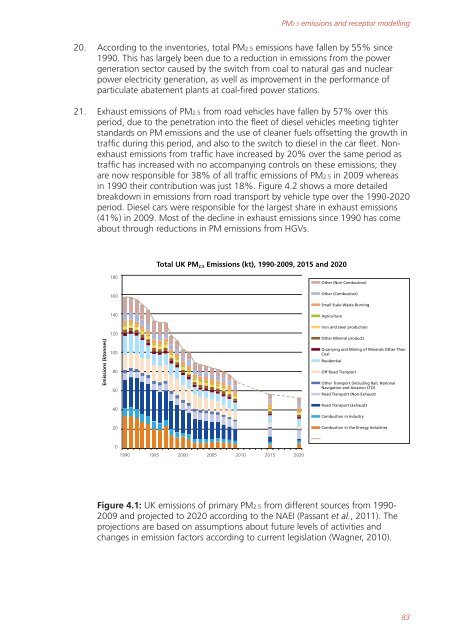
20. Accord<strong>in</strong>g to the <strong>in</strong>ventories, total <strong>PM2.5</strong> emissions have fallen by 55% s<strong>in</strong>ce<br />
1990. This has largely been due to a reduction <strong>in</strong> emissions from the power<br />
generation sector caused by the switch from coal to natural gas and nuclear<br />
power electricity generation, as well as improvement <strong>in</strong> the performance of<br />
<strong>particulate</strong> abatement plants at coal-fired power stations.<br />
21. Exhaust emissions of <strong>PM2.5</strong> from road vehicles have fallen by 57% over this<br />
period, due to the penetration <strong>in</strong>to the fleet of diesel vehicles meet<strong>in</strong>g tighter<br />
standards on PM emissions and the use of cleaner fuels offsett<strong>in</strong>g the growth <strong>in</strong><br />
traffic dur<strong>in</strong>g this period, and also to the switch to diesel <strong>in</strong> the car fleet. Nonexhaust<br />
emissions from traffic have <strong>in</strong>creased by 20% over the same period as<br />
traffic has <strong>in</strong>creased with no accompany<strong>in</strong>g controls on these emissions; they<br />
are now responsible for 38% of all traffic emissions of <strong>PM2.5</strong> <strong>in</strong> 2009 whereas<br />
<strong>in</strong> 1990 their contribution was just 18%. Figure 4.2 shows a more detailed<br />
breakdown <strong>in</strong> emissions from road transport by vehicle type over the 1990-2020<br />
period. Diesel cars were responsible for the largest share <strong>in</strong> exhaust emissions<br />
(41%) <strong>in</strong> 2009. Most of the decl<strong>in</strong>e <strong>in</strong> exhaust emissions s<strong>in</strong>ce 1990 has come<br />
about through reductions <strong>in</strong> PM emissions from HGVs.<br />
Emissions (ktonnes)<br />
180<br />
160<br />
140<br />
120<br />
100<br />
80<br />
60<br />
40<br />
20<br />
Total UK <strong>PM2.5</strong> Emissions (kt), 1990-2009, 2015 and 2020<br />
0<br />
1990 1995 2000 2005 2010 2015 2020<br />
Other (Non-Combustion)<br />
Other (Combustion)<br />
Small Scale Waste Burn<strong>in</strong>g<br />
Agriculture<br />
Iron and steel production<br />
Other M<strong>in</strong>eral products<br />
Quarry<strong>in</strong>g and M<strong>in</strong><strong>in</strong>g of M<strong>in</strong>erals Other Than<br />
Coal<br />
Residential<br />
Off Road Transport<br />
Other Transport (<strong>in</strong>clud<strong>in</strong>g Rail, National<br />
Navigation and Aviation LTO)<br />
Road Transport (Non-Exhaust)<br />
Road Transport (Exhaust)<br />
Combustion <strong>in</strong> Industry<br />
Combustion <strong>in</strong> the Energy Industries<br />
Figure 4.1: UK emissions of primary <strong>PM2.5</strong> from different sources from 1990-<br />
2009 and projected to 2020 accord<strong>in</strong>g to the NAEI (Passant et al., 2011). The<br />
projections are based on assumptions about future levels of activities and<br />
changes <strong>in</strong> emission factors accord<strong>in</strong>g to current legislation (Wagner, 2010).<br />
83


