

Air quality expert group - Fine particulate matter (PM2.5) in ... - Defra
Air quality expert group - Fine particulate matter (PM2.5) in ... - Defra
Air quality expert group - Fine particulate matter (PM2.5) in ... - Defra

You also want an ePaper? Increase the reach of your titles
YUMPU automatically turns print PDFs into web optimized ePapers that Google loves.
<strong>PM2.5</strong> emissions and receptor modell<strong>in</strong>g<br />
25. Figures 4.1 and 4.2 showed the latest UK emission projections for <strong>PM2.5</strong> to<br />
2020. Future emissions of <strong>PM2.5</strong> are predicted to fall by nearly 17 ktonnes by<br />
2020, a decrease of 25% relative to 2009 levels. Most of this decrease<br />
(10 ktonnes) is due to a reduction <strong>in</strong> exhaust emissions from road transport<br />
due to the cont<strong>in</strong>ued fleet penetration of vehicles meet<strong>in</strong>g tighter emission<br />
standards. Emissions from off-road transport are expected to fall by 5 ktonnes,<br />
the next largest contributor to overall UK emission reductions. Figure 4.2<br />
illustrates how much more important the non-exhaust components of traffic<br />
emissions will become by 2020. Unless measures are taken to reduce these<br />
emissions, and tak<strong>in</strong>g <strong>in</strong>to account the predicted decrease <strong>in</strong> exhaust emissions,<br />
the contribution made by non-exhaust traffic emissions (tyre and brake wear,<br />
and road abrasion) will <strong>in</strong>crease from 38% of all road transport emissions <strong>in</strong><br />
2009 to 81% <strong>in</strong> 2020. This is based on current assumptions about the fraction<br />
of PM emitted from non-exhaust traffic sources as <strong>PM2.5</strong>, but there is doubt, as<br />
discussed later <strong>in</strong> this section, as to whether any of the tyre wear PM mass is<br />
emitted <strong>in</strong> the <strong>PM2.5</strong> fraction. If this is the case, then the contribution from the<br />
rema<strong>in</strong><strong>in</strong>g non-exhaust <strong>PM2.5</strong> emissions (brake wear and road abrasion) to total<br />
traffic <strong>PM2.5</strong> emissions will be 27% <strong>in</strong> 2009 ris<strong>in</strong>g to 71% <strong>in</strong> 2020. This clearly<br />
emphasises the need to <strong>in</strong>troduce measures to control emissions from<br />
these non-exhaust traffic sources.<br />
Emissions (ktonnes)<br />
2500<br />
2000<br />
1500<br />
1000<br />
500<br />
0<br />
1990<br />
1991<br />
1992<br />
1993<br />
1994<br />
1995<br />
1996<br />
1997<br />
Total EU-27 <strong>PM2.5</strong> Emissions (kt), 1990-2008<br />
1998<br />
1999<br />
2000<br />
2001<br />
2002<br />
2003<br />
2004<br />
2005<br />
2006<br />
2007<br />
2008<br />
Other (Non-Combustion)<br />
Other (Combustion)<br />
Small Scale Waste Burn<strong>in</strong>g<br />
Agriculture<br />
Iron and steel production<br />
Other M<strong>in</strong>eral products<br />
Quarry<strong>in</strong>g and M<strong>in</strong><strong>in</strong>g of M<strong>in</strong>erals Other Than Coal<br />
Residential<br />
Off Road Transport<br />
Other Transport (<strong>in</strong>clud<strong>in</strong>g Rail, National Navigation<br />
and Aviation LTO)<br />
Road Transport (Non-Exhaust)<br />
Road Transport (Exhaust)<br />
Combustion <strong>in</strong> Industry<br />
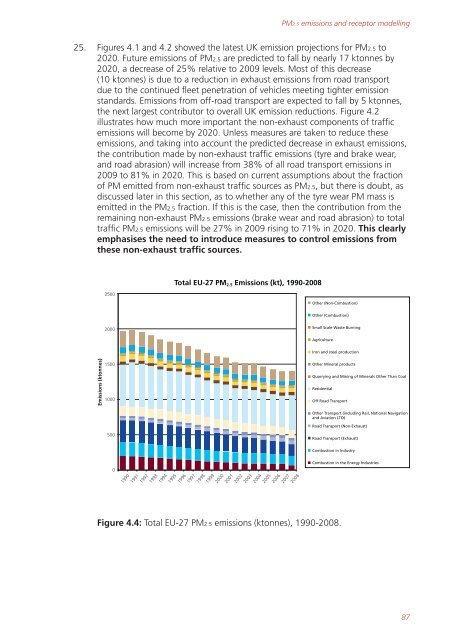
Figure 4.4: Total EU-27 <strong>PM2.5</strong> emissions (ktonnes), 1990-2008.<br />
Combustion <strong>in</strong> the Energy Industries<br />
87


