

Air quality expert group - Fine particulate matter (PM2.5) in ... - Defra
Air quality expert group - Fine particulate matter (PM2.5) in ... - Defra
Air quality expert group - Fine particulate matter (PM2.5) in ... - Defra

You also want an ePaper? Increase the reach of your titles
YUMPU automatically turns print PDFs into web optimized ePapers that Google loves.
<strong>PM2.5</strong> <strong>in</strong> the UK<br />
142<br />
the North Sea (although this is more than offset by <strong>in</strong>creases <strong>in</strong> NOx from the<br />
growth <strong>in</strong> shipp<strong>in</strong>g). This emphasises the dependence of trends <strong>in</strong> <strong>PM2.5</strong> on<br />
future projections of emissions outside the UK, and hence on the revision of<br />
national emission ceil<strong>in</strong>gs under CLRTAP and the EU’s <strong>Air</strong> Quality Directive.<br />
Another uncerta<strong>in</strong>ty <strong>in</strong> both models arises from the l<strong>in</strong>ear extrapolation of the<br />
response of SIA concentrations to changes <strong>in</strong> emissions (see Section 5.4).<br />
48. Trends <strong>in</strong> primary components are more consistent between the two models,<br />
but UKIAM estimates lower concentrations than the PCM model, and both may<br />
underestimate where emission <strong>in</strong>ventories are <strong>in</strong>complete.<br />
49. For both models there is still a substantial contribution from other components<br />
which is highly uncerta<strong>in</strong>. The UKIAM model used the same treatment of<br />
urban and rural dusts and sea salt developed for the PCM model, so these are<br />
effectively the same; and both adopt SOA modell<strong>in</strong>g undertaken <strong>in</strong>dependently<br />
and assumed to be unchanged over time. The UKIAM model uses modelled<br />
water content from the EMEP model but does not allow for any change <strong>in</strong><br />
this component <strong>in</strong> conjunction with soluble SIA components. Further work is<br />
needed on the contribution of all these additional components.<br />
50. In conclusion, there are significant differences between the prelim<strong>in</strong>ary<br />
projections to 2020 from the two models, both <strong>in</strong> source apportionment<br />
and trends, and <strong>in</strong> assumptions about future emissions. These need further<br />
<strong>in</strong>vestigation, ideally with extension to other models, tak<strong>in</strong>g note of the<br />
uncerta<strong>in</strong>ties and gaps <strong>in</strong> knowledge <strong>in</strong>dicated <strong>in</strong> this report concern<strong>in</strong>g, <strong>in</strong>ter<br />
alia, emission <strong>in</strong>ventories and projections. When consider<strong>in</strong>g the multiple<br />
components of <strong>PM2.5</strong>, each of which presents different problems to quantify,<br />
model validation is not possible <strong>in</strong> the absence of new speciated measurements<br />
to give a detailed breakdown of overall <strong>PM2.5</strong> concentrations.<br />
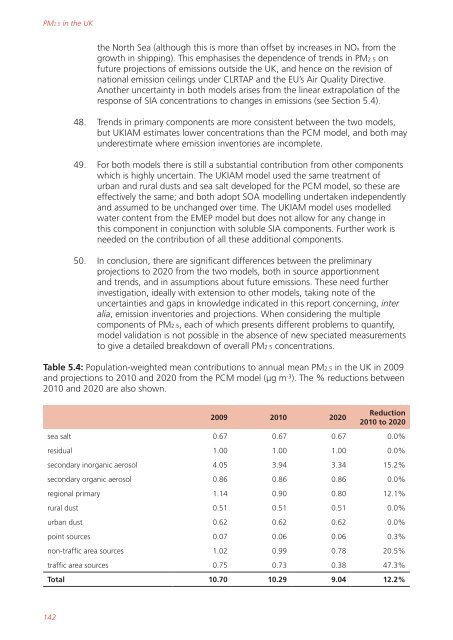
Table 5.4: Population-weighted mean contributions to annual mean <strong>PM2.5</strong> <strong>in</strong> the UK <strong>in</strong> 2009<br />
and projections to 2010 and 2020 from the PCM model (µg m -3 ). The % reductions between<br />
2010 and 2020 are also shown.<br />
2009 2010 2020<br />
Reduction<br />
2010 to 2020<br />
sea salt 0.67 0.67 0.67 0.0%<br />
residual 1.00 1.00 1.00 0.0%<br />
secondary <strong>in</strong>organic aerosol 4.05 3.94 3.34 15.2%<br />
secondary organic aerosol 0.86 0.86 0.86 0.0%<br />
regional primary 1.14 0.90 0.80 12.1%<br />
rural dust 0.51 0.51 0.51 0.0%<br />
urban dust 0.62 0.62 0.62 0.0%<br />
po<strong>in</strong>t sources 0.07 0.06 0.06 0.3%<br />
non-traffic area sources 1.02 0.99 0.78 20.5%<br />
traffic area sources 0.75 0.73 0.38 47.3%<br />
Total 10.70 10.29 9.04 12.2%


